These best practices reflect recommendations shared by a cross-functional team of seasoned Lookers. These insights come from years of experience working with Looker customers, from implementation to long-term success. The practices are written to work for most users and situations, but you should use your best judgment when implementing.
LookML developers can consider following these tips to improve their users' experience with Looker:
- Provide users with meaningful field names
- Group similar fields together for easier navigation
- Avoid exposing too much to users initially
- Add descriptions so users know which fields and Explores to use
- Build common workflows into Looker
These recommendations are explained in further detail in the sections that follow.
Provide users with meaningful field names
-
Use the
labelparameter to apply user-friendly names to dimensions or measures while maintaining database-friendly names within the view and model files. You might consider renaming a couple of common terms, like Count to Number of and Sum to Total. If you aren't sure which words are meaningful to users, work with a business user to build some common queries, and see what words the query results use to describe what users are looking for. As an example, suppose the Inventory Items, Order Items, Orders, and Products views each have a measure called Count. You can use thelabelparameter to give each of these measures a unique and meaningful name, such as Number of Inventory Items, Number of Order Items, Number of Orders, and Number of Products. -
Avoid exposing multiple fields with the same name. For example, measures of
type: countare automatically created within Looker with the name Count. This results in most view files containing a count measure with the same name. Multiple fields with the same name can confuse users. Adding labels or renaming count measures to indicate the object that is being counted will prevent confusion. Other fields to keep in mind include Created Date and Updated Date, such as in dimension groups. -
Provide clear names for fields of
type: yesno. For example, use Was the Item Returned? instead of Returned to name a field that indicates whether an item has been returned. - Name ratios descriptively. For example, Orders Per Purchasing Customers is clearer than Orders Percent.
-
Name fields and represent values consistently across the model. Using the
value_formatorvalue_format_nameparameter to apply formatting such as currency symbols, percentages, and decimal precision to numerical fields will help make everything clearer to your users.
Group similar fields together for easier navigation
-
Use the
group_labelparameter to consolidate dimensions and measures from individual or multiple joined views that are related. For example, group all geographic information into a Geography group to pull all address and location information together within the field picker, rather than having it all listed alphabetically:dimension: city { group_label: "Geography" type: string sql: ${TABLE}.city ;; } dimension: country { group_label: "Geography" type: string map_layer_name: countries sql: ${TABLE}.country ;; }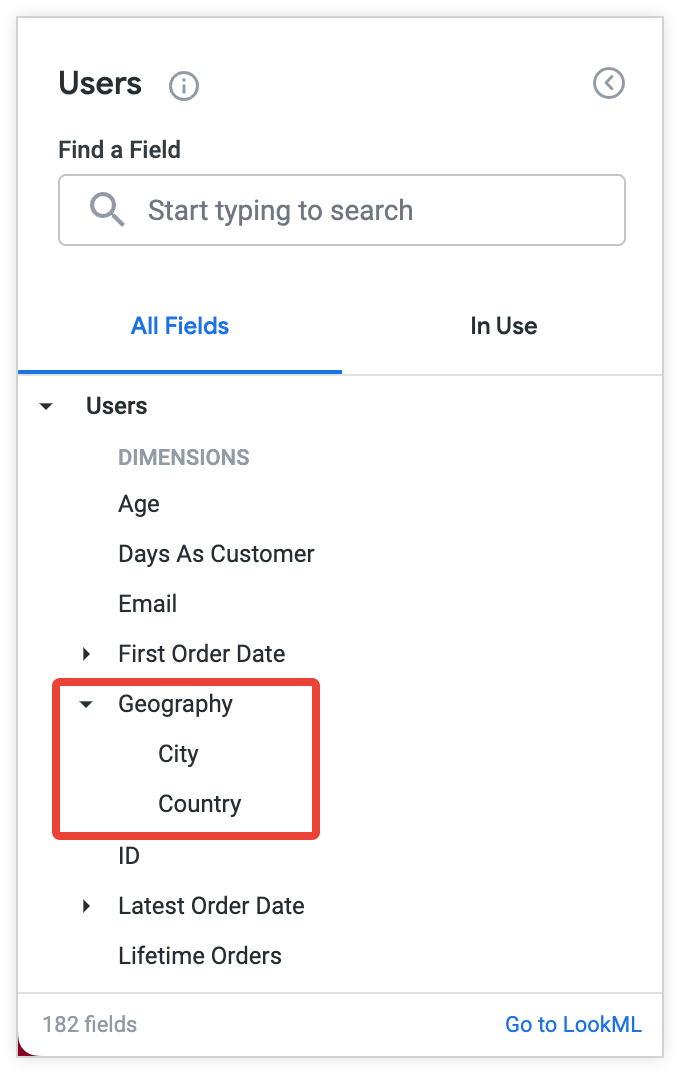
-
Break up large, denormalized tables using the
view_labelparameter. Utilize theview_labelparameter within fields to group fields together logically into separate headings within the field picker. Large, denormalized tables with a lot of fields can be difficult to navigate, so this gives the illusion of multiple views in the left-hand Explore field picker.
Avoid exposing too much to users initially
- Avoid exposing too much to users upon an initial Looker roll-out. Start small, and then expand the options. You don't have to expose all the tables or dimensions and measures at once. You can expose the most important fields at first and then continue to build in more functionality as business users become more confident with data exploration.
-
Hide dimensions that are not relevant to users from the user interface. Use the
hiddenparameter on dimensions that will never be used through the user interface (such as ID fields or database update dates). -
Use the
fieldsparameter within Explores and joins to limit the number of fields that are available to users. Included fields should be only those relevant to the Explore. This reduces bloat and provides a better experience for users. Unlike thehiddenparameter, thefieldparameter enables fields to be included or excluded on an Explore-by-Explore basis. -
Hide any Explores that exist solely for populating specific Looks, dashboard tiles, or filters using the
hiddenparameter for Explores. Explores that are not meant for exploration by users should be hidden from the user interface. -
Use the fewest number of Explores possible while still allowing users to easily get access to the answers they need. Consider splitting out Explores into different models for different audiences to limit the options available for each user group. The optimal number of Explores is different for every business, but having too many Explores tends to confuse users. Consider using the
group_labelparameter for Explores within a model, which will let you group them in a sensible way within the Explore drop-down menu.
Add descriptions so users know which fields and Explores to use
-
Use the
descriptionparameter on dimensions and measures to provide additional information to users about the logic or calculations that are used within the model. This is particularly important for dimensions and measures that leverage complex logic or calculations. That being said, it's a good idea to also consider descriptions for simpler fields to be sure that users understand the definitions behind them. - Define Explore descriptions for users. Add a short description to each Explore to specify the purpose of the Explore and the audience who will use it.
Build common workflows into Looker
-
Add
drill_fieldsto all relevant measures. Drill fields enable users to click into aggregate values in order to access detailed data. Use thesetparameter to create reusable sets of fields that can then be applied to any number of measures within a view. -
Add
drill_fieldsto all hierarchical dimensions. For example, adding adrill_fieldfor City into a State dimension will let users select a state and then drill deeper into the cities within that state. Note that this hierarchical drilling will automatically be applied within time dimension groups. -
Set up links that enable users to easily navigate and pass filters to other Looker dashboards or to systems or platforms that are external to Looker. See our
documentation on the
linkparameter for examples of passing filters through drills.