As an alternative to the methods that this page describes, you can use shortcut calculations to perform common calculations on numeric fields that are in an Explore's data table without using Looker functions and operators when you have the permissions to create table calculations.
Table calculations let you create ad hoc metrics and perform calculations on the data that is returned by an Explore query. This is convenient for calculating metrics like percent of previous and percent change.
This page shows you how to calculate these metrics — both down columns and across pivoted rows.
Calculating percent of previous and percent change down columns using offset()
The offset() table calculation function lets you reference values from other rows in the same column. This is perfect for calculating percent of previous and percent change down columns.
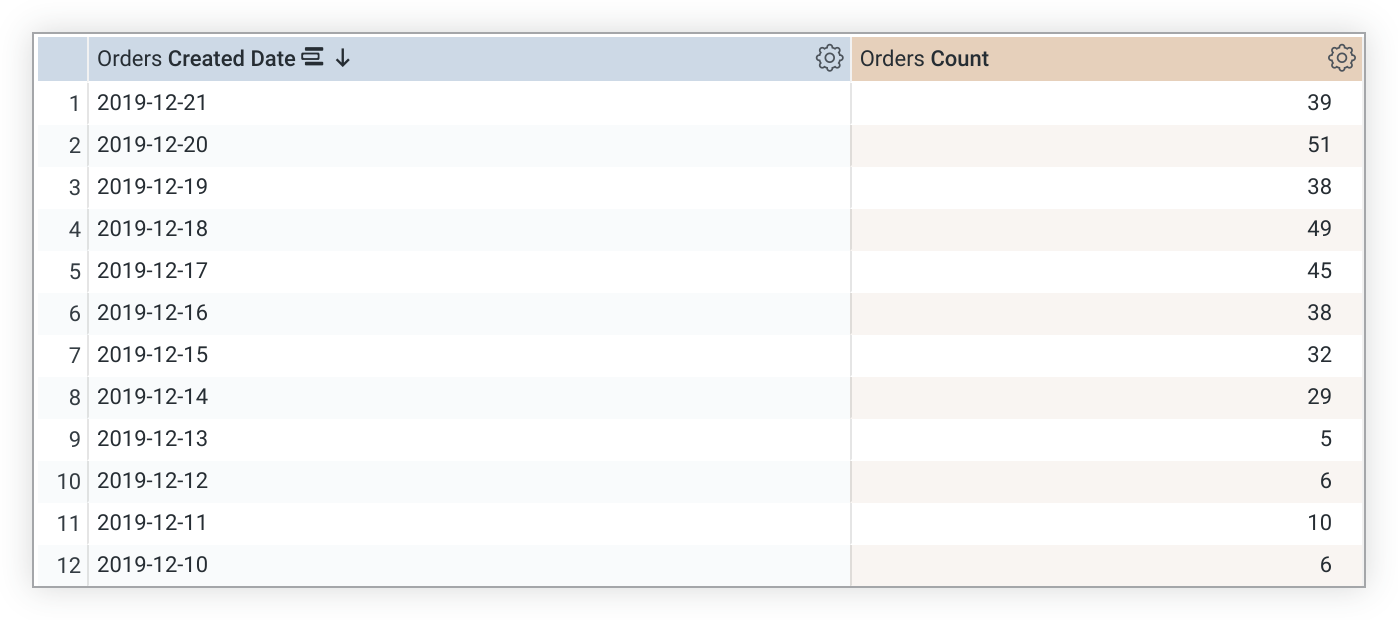
The following examples use the data from the following table, which includes Orders Count grouped by Orders Created Date:
Calculating percent of previous down columns using offset()
To calculate the percent of previous of orders.count, you can make a table calculation such as the following:
${orders.count} / offset(${orders.count}, -1)This calculation divides each value in the column by the value in the row that precedes it.
Calculating percent change down columns using offset()
You can calculate percent change similarly to percent of previous, and then subtract the entire calculation by 1:
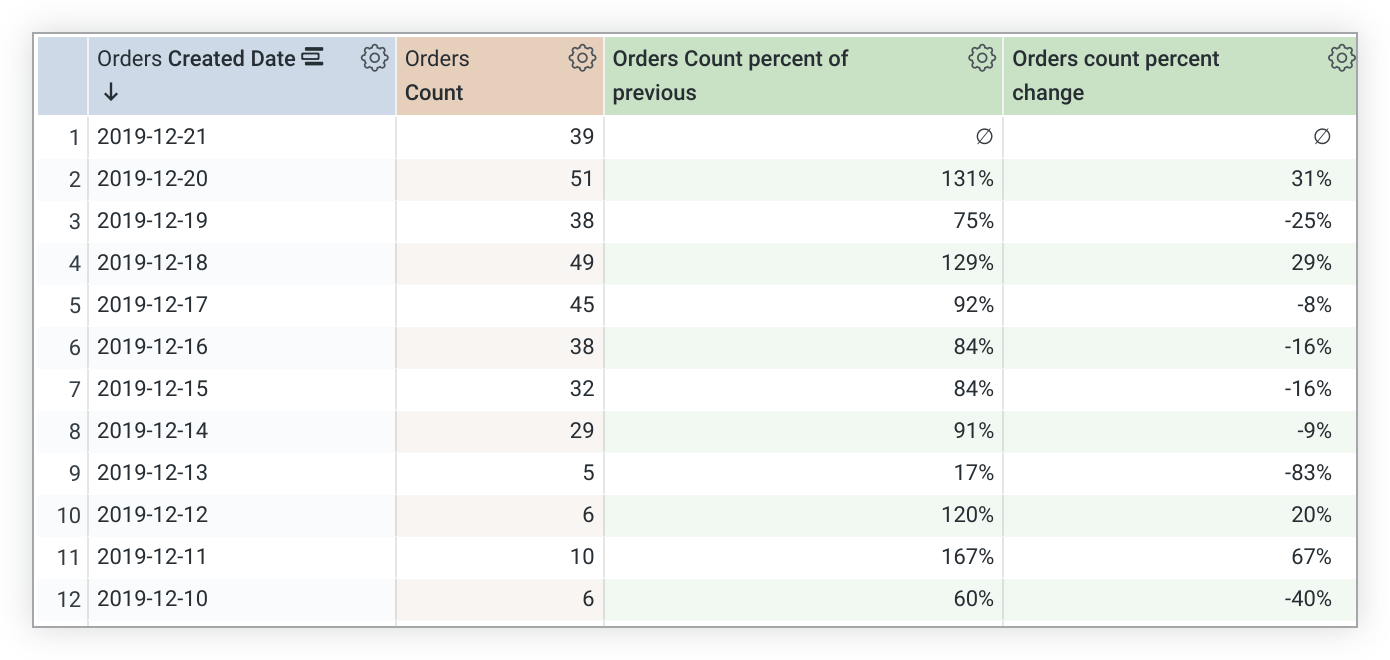
${orders.count} / offset(${orders.count}, -1) -1 The results
The percent of previous and percent change table calculations yield the following results:
You can customize the format of table calculation values by selecting a format from the Format drop-down menu in the Create table calculation or Edit table calculation pop-up. Alternatively, you can use custom formatting as explained on the Adding custom formatting to numeric fields documentation page (if you want something other than the available default formats).
Calculating percent change and percent of previous across rows using pivot_offset()
With pivoted results, the pivot_offset() table calculation function lets you reference values that are on the same row in different columns. In the following examples, using pivot_offset(), -1 references the previous column (rather than the previous row).
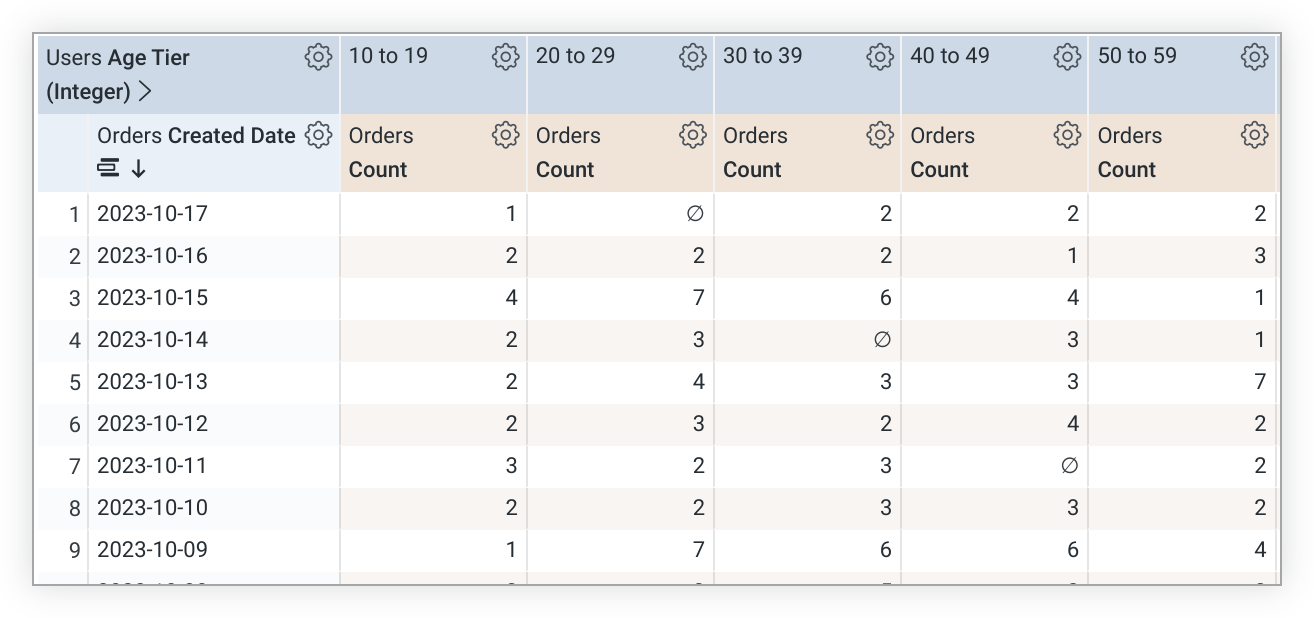
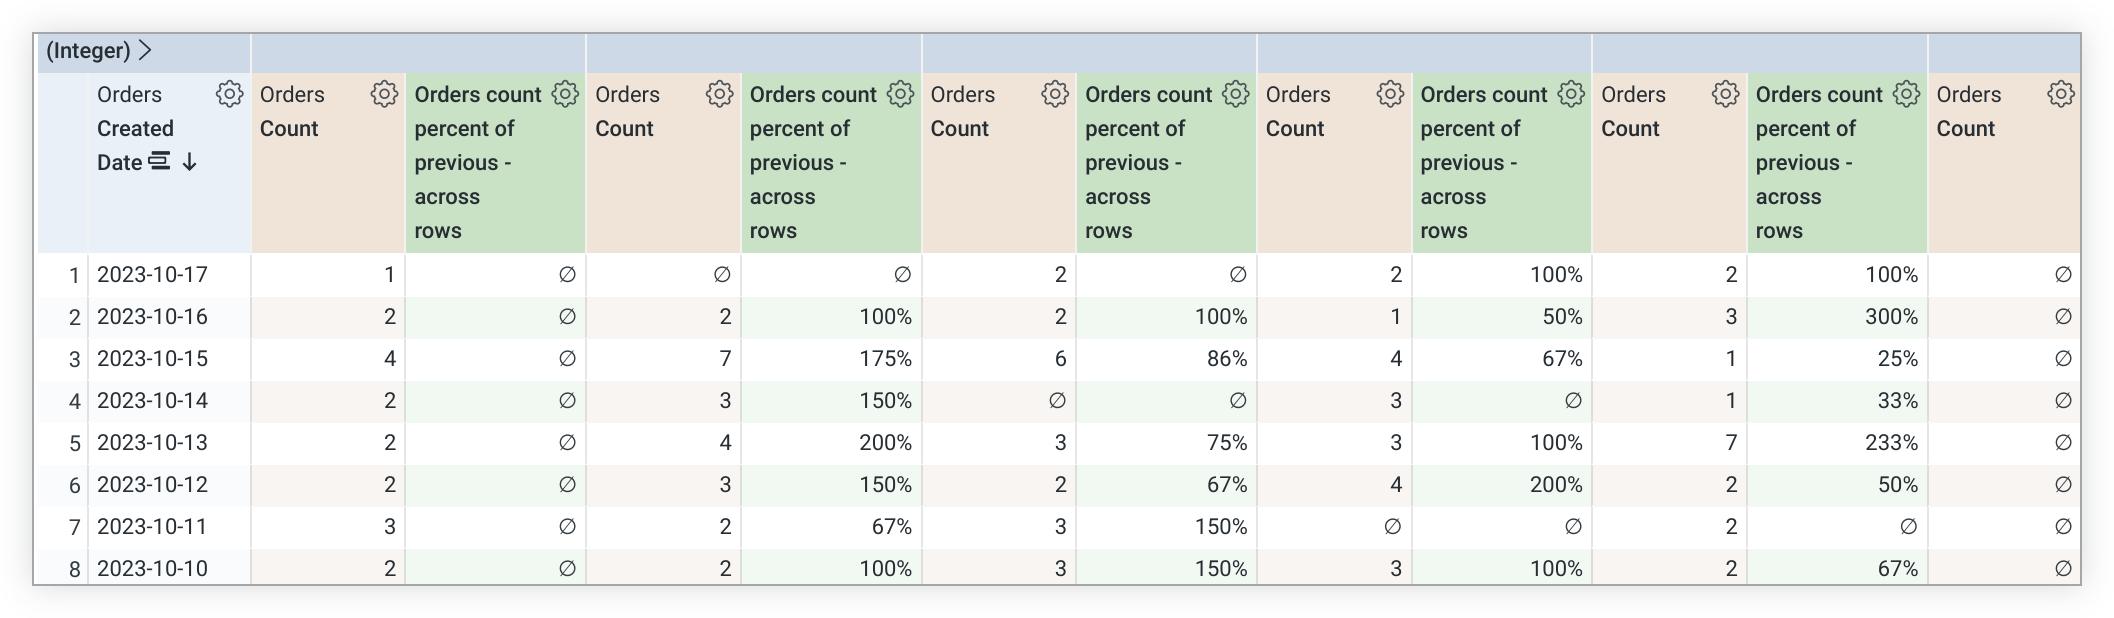
The following examples use the data from the following table, which includes Orders Count grouped by Orders Created Date and pivoted by Users Age Tier:
Calculating percent of previous across pivoted rows using pivot_offset()
To calculate percent of previous across rows, you can use pivot_offset()
in the same way that offset() was used in the examples that showed how to calculate the percent of previous and the percent change down columns:
${orders.count} / pivot_offset(${orders.count}, -1)This expression divides each value in the table by the value in the same row, located one column to the left. This results in the following table:
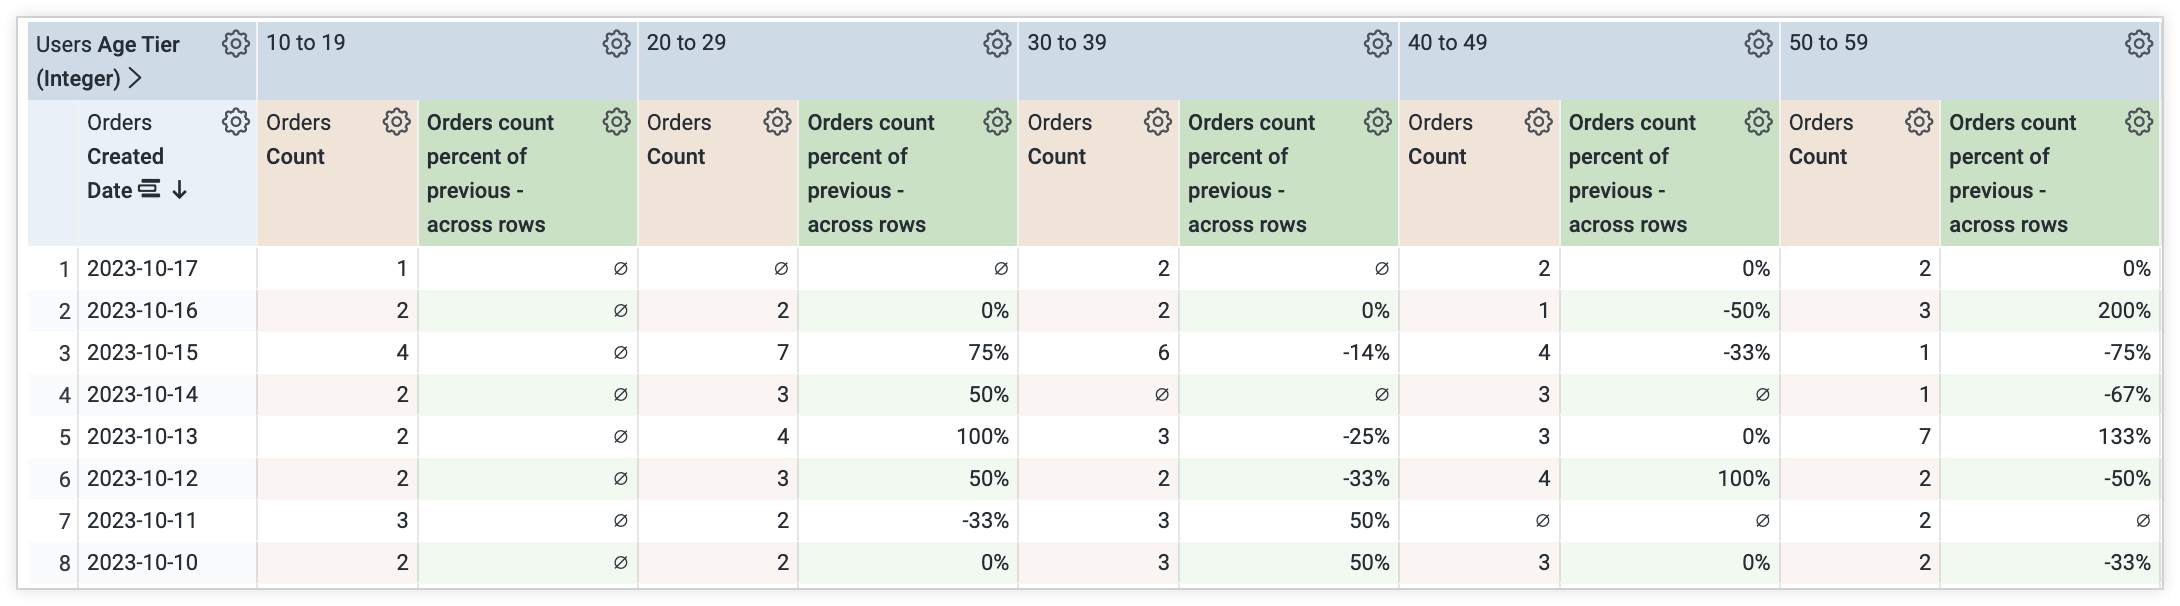
Calculating percent change across pivoted rows using pivot_offset()
Again, you can use pivot_offset() to make calculations across pivoted rows the same way you use offset()
when calculating down columns:
(${orders.count} / pivot_offset(${orders.count}, -1)) - 1This is the same expression as percent of previous, just subtracted by 1. This results in the following table: