You can use shortcut calculations to perform common calculations on numeric fields that are in an Explore's data table without using Looker functions and operators when you have the permissions to create table calculations.
It's valuable to call out rows that meet (or don't meet) certain conditions in some query results. This pattern is often referred to as conditional formatting in Google Sheets or other spreadsheet applications.
Looker supports conditional formatting in visualizations in several different ways:
-
With the
htmlLookML parameter. This is ideal for formatting values when the conditions that drive the formatting are consistent across analysis for a given field. - With table calculations. This approach is ideal when the conditions that determine the formatting need to be assignable from Looker's Explore UI.
- Directly in the visualization settings for table charts.
The second approach, which leverages table calculations to determine conditional formatting, is detailed on this page with two examples that use emoji
To enable emoji:
-
For Mac:
CTRL + CMD + SPACEbrings up the emoji keyboard that lets you select emoji to drop into a table calculation. - For Windows: This Buffer article about emoji keyboard shortcuts goes over how to enable and use emoji.
Note: Not all backend databases support emoji in table calculations. Emoji may unexpectedly break if your instance is migrated to a MySQL backend. Consider using conditional formatting for table charts from the visualization settings editor in an Explore, or implementing the conditional formatting using HTML instead.
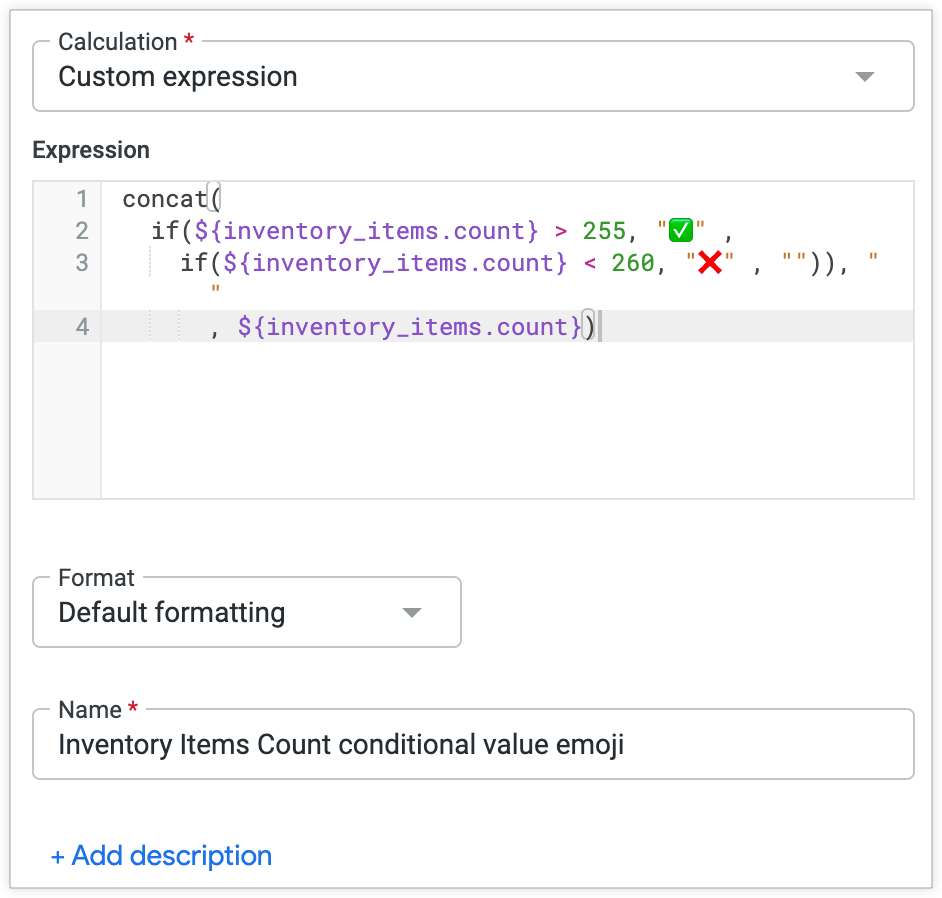
Example 1
The following example is based on an Explore query with Inventory Items Count grouped by Inventory Items Created Date. A user wants to add an emoji to indicate whether a value of Inventory Items Count is greater than or less than a specified number.
The first step is to create a calculation that uses the if function to specify a condition for categorizing Inventory Items Count values, and the concat function to prepend an emoji character depending on whether or not the values satisfy the condition.
The user wants to use emoji to indicate whether or not a value meets the condition. A green check mark emoji indicates a value that meets the condition, and a red x emoji indicates a value that does not meet the condition.
The table calculation is:
concat(
  if(${inventory_items.count} > 255, "<emoji>" ,
    if(${inventory_items.count} < 260, "<different_emoji>" , " ")), " "
      ,${inventory_items.count})
Here the table calculation is shown with emoji in the Create table calculation menu:
This table calculation produces the following table visualization:
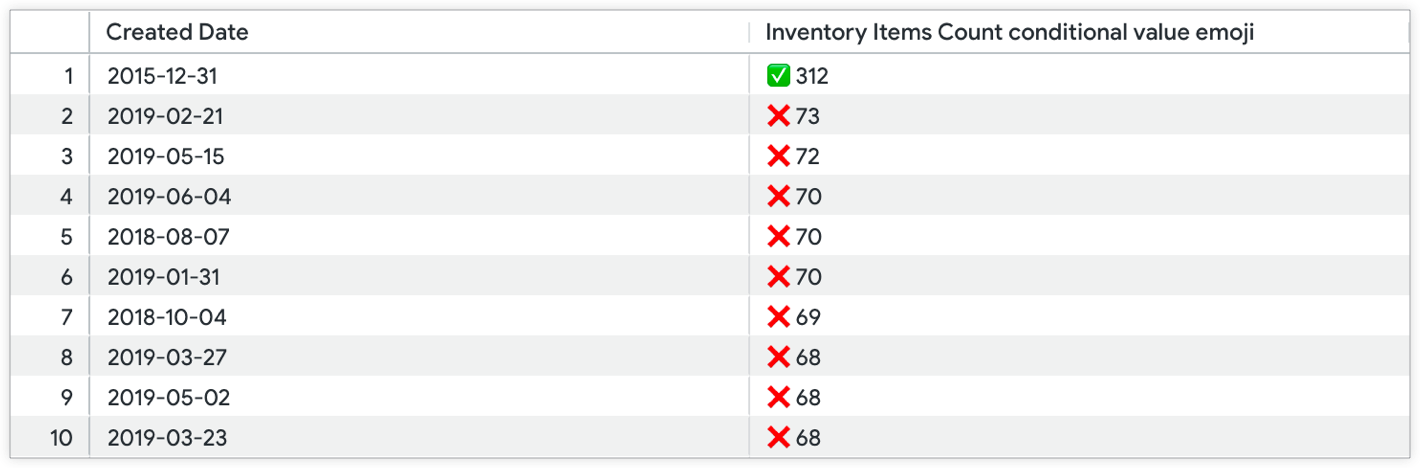
The Inventory Items Count measure column is hidden from the visualization, so only the table calculation column with the conditionally prepended emoji is visualized.
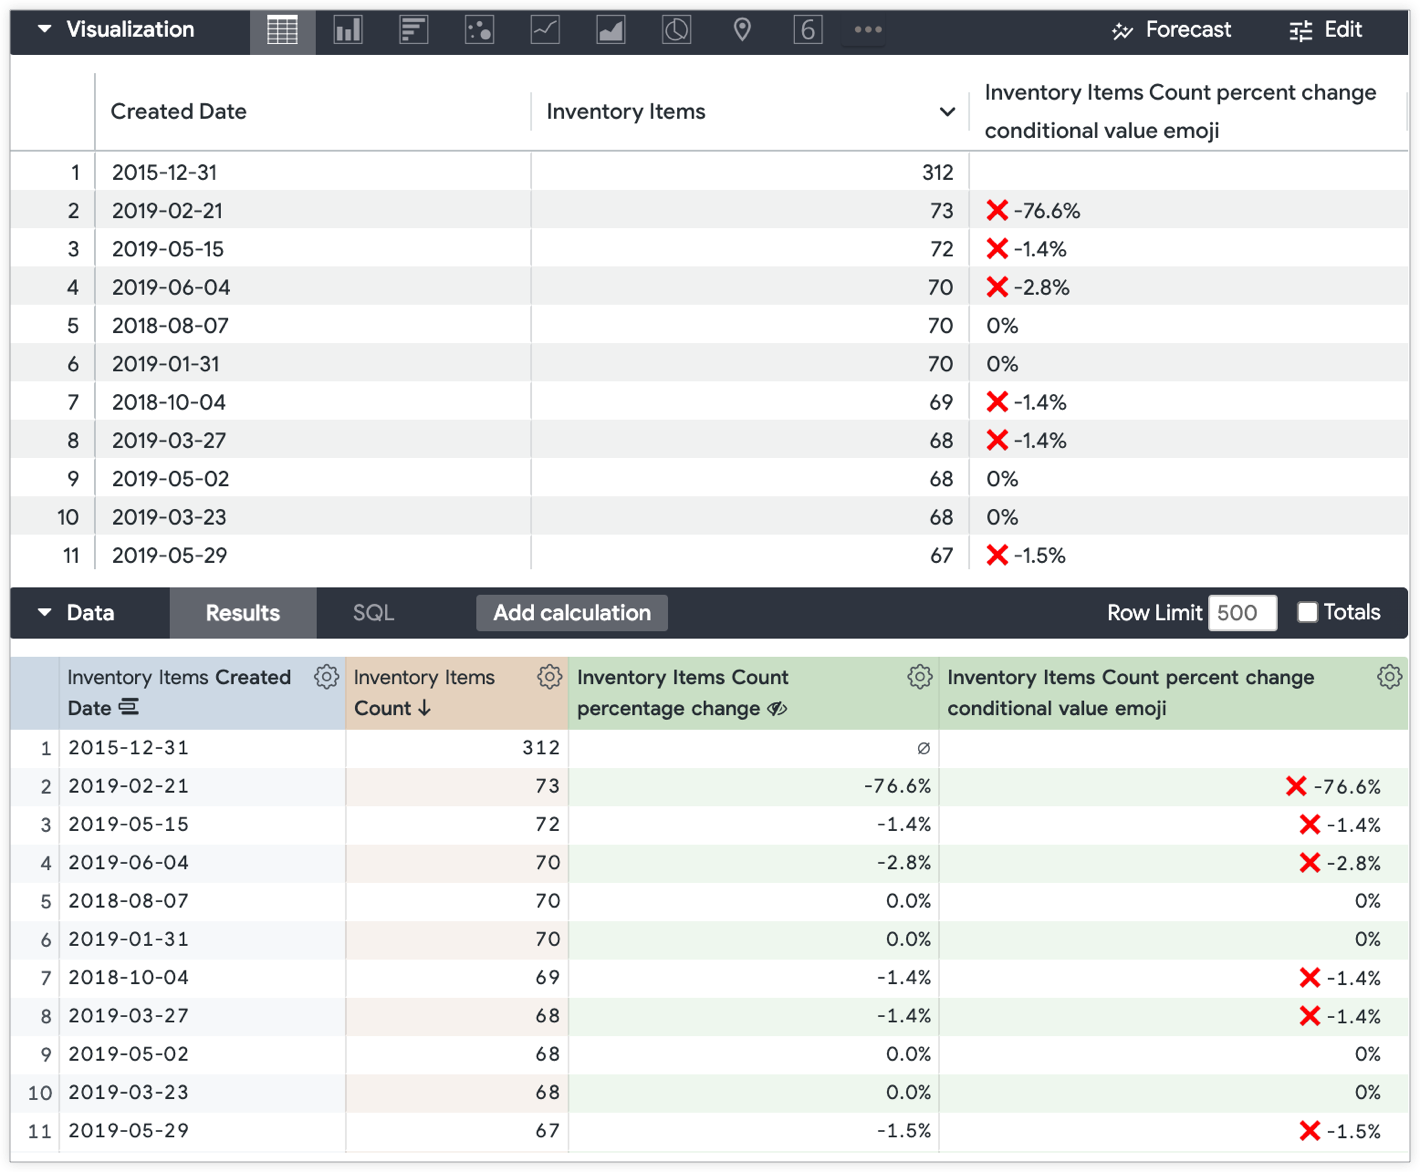
Example 2
Similarly, the Example 1 conditional formatting pattern can be applied to a percent change table calculation to call attention to rows that may warrant additional attention. The following example has two calculations. This example also uses the Explore with Inventory Items Count grouped by Inventory Items Created Date.
The first table calculation returns the percent change (using the offset function to compare values associated with different dates in the same column):
  (${inventory_items.count} - offset(${inventory_items.count},
  -1))/offset(${inventory_items.count}, -1)
In this example of an Explore, the table calculation is named Inventory Items Count percentage change, which is referenced in the second table calculation.
The second table calculation applies the if condition and concat function to prepend a red x emoji to days where Inventory Items Counthas negative growth as compared to the day before:
  concat(
    if((${inventory_items_count_percentage_change}*100) < 0, "<emoji>", " "), " ",
    round(${inventory_items_count_percentage_change}*100,1),
    if(is_null(${inventory_items_count_percentage_change}), " ", "%"))
These two table calculations produce an Explore data table with two new rows for the Inventory Items Count percentage change and Inventory Items Count percent change conditional value emoji table calculations. The resulting table visualization displays the results for all fields except Inventory Items Count percentage change. The Inventory Items Count percentage change table calculation is hidden from the table visualization: