You can add a reference line to several available Looker visualization types:
Default reference line options include static value, median, average (mean), maximum, minimum, and range, which can be selected from the visualization option settings Edit menu.
However, you may want to represent a more specific metric — such as a weighted average — with a reference line, instead of the default reference line options. You can make custom reference lines by creating table calculations and then plotting them in visualizations.
Continuing with the weighted average example shown previously, let's say you wanted to weight average user age by the count of users and had measures for each of these in an Explore. To create a weighted average vertical reference line, you would perform the following steps:
- Add the Users Count measure and Users Average Age measures to an Explore query.
-
Create a table calculation like the following to calculate the weighted average with the two measures:
mean(sum(${users.count}*${users.average_age})/sum(${users.count}))The table calculation will return a single value — the weighted average — for every row of the query.
-
If the selected visualization type is not a line chart, such as a column chart or bar chart, you can visualize the table calculation as a line by selecting the Line visualization type for the table calculation series on the
Series tab of the Edit menu. Since the table calculation only returns one value, the line will appear as a horizontal reference line.
If you do not want Users Average Age to appear in your visualization, you can also hide that field using the Hide from Visualization option.
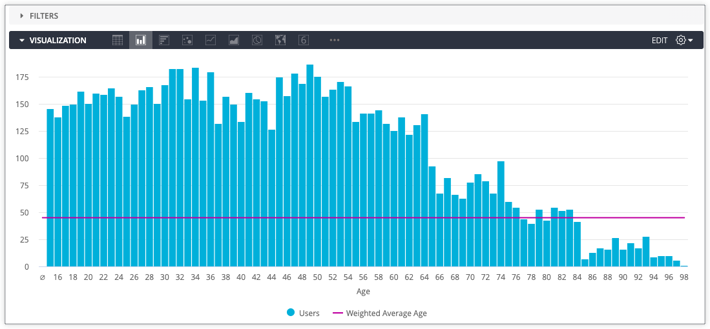
Visualized as a column chart, the Users Count and Users Average Age grouped by Users Age Explore data looks like the following with the Weighted Average Age reference line:
If you want to be able to reuse the table calculation in future Explores, you can re-create the calculation between numeric fields with a number type measure.