Derived tables open up a world of advanced analytical possibilities, but they can be daunting to approach, implement, and troubleshoot. This cookbook contains the most popular use cases of derived tables in Looker.
This page contains the following examples:
- Building a table at 3 AM daily
- Appending new data to a large table
- Using SQL window functions
- Creating derived columns for calculated values
- Optimization strategies
- Using PDTs to test optimizations
UNIONtwo tables- Taking a sum of a sum (dimensionalizing a measure)
- Rollup tables with aggregate awareness
Derived table resources
These cookbooks assume you have an introductory understanding of LookML and derived tables. You should be comfortable making views and editing the model file. If you want a refresher on any of these topics, check out the following resources:
- Derived tables
- LookML terms and concepts
- Creating native derived tables
derived_tableparameter reference- Caching queries and rebuilding PDTs with datagroups
Building a table at 3 AM daily
Data in this example comes in at 2 AM every day. The results of a query on this data will be the same whether it's run at 3 AM or at 9 PM. Therefore, it makes sense to build the table once a day and let users pull results from a cache.
Including your datagroup in the model file lets you reuse it with multiple tables and Explores. This datagroup contains a sql_trigger_value parameter that tells the datagroup when to trigger and rebuild the derived table.
For more examples of trigger expressions, see the sql_trigger_value documentation.
## in the model file

datagroup: standard_data_load {
  sql_trigger_value: SELECT FLOOR(((TIMESTAMP_DIFF(CURRENT_TIMESTAMP(),'1970-01-01 00:00:00',SECOND)) - 60*60*3)/(60*60*24)) ;;
  max_cache_age: "24 hours"
}

explore: orders {
…
Add the datagroup_trigger parameter to the derived_table definition in the view file, and specify the name of the datagroup that you want to use. In this example, the datagroup is standard_data_load.
view: orders {
 derived_table: {
  indexes: ["id"]
  datagroup_trigger: standard_data_load
    sql:
      SELECT
        user_id,
        id,
        created_at,
        status
      FROM
        demo_db.orders
      GROUP BY
        user_id ;;
    }

…
}
Appending new data to a large table
An incremental PDT is a persistent derived table that Looker builds by appending fresh data to the table, instead of rebuilding the table in its entirety.
The next example builds on the orders table example to show how the table builds incrementally. New order data comes in every day and can be appended to the existing table when you add an increment_key parameter and increment_offset parameter.
view: orders {
 derived_table: {
    indexes: ["id"]
    increment_key: "created_at"
    increment_offset: 3
    datagroup_trigger: standard_data_load
    distribution_style: all
    sql:
      SELECT
        user_id,
        id,
        created_at,
        status
      FROM
        demo_db.orders
      GROUP BY
        user_id ;;
    }

  dimension: id {
    primary_key: yes
    type: number
    sql: ${TABLE}.id ;;  }

…
}
The increment_key value is set to created_at, which is the time increment for which fresh data should be queried and appended to the PDT in this example.
The increment_offset value is set to 3 to specify the number of previous time periods (at the increment key's granularity) that are rebuilt to account for late-arriving data.
Using SQL window functions
Some database dialects support window functions, especially to create sequence numbers, primary keys, running and cumulative totals, and other useful multi-row calculations. After the primary query has been executed, any derived_column declarations are executed in a separate pass.
If your database dialect supports window functions, you can use them in your native derived table. Create a derived_column parameter with a sql parameter that contains your window function. When referring to values, you should use the column name as defined in your native derived table.
The following example shows how to create a native derived table that includes the user_id, order_id, and created_time columns. You would then use a derived column with a SQL ROW_NUMBER() window function to calculate a column that contains the sequence number of a customer's order.
view: user_order_sequences {
  derived_table: {
    explore_source: order_items {
      column: user_id {
        field: order_items.user_id
      }
      column: order_id {
        field: order_items.order_id
      }
      column: created_time {
        field: order_items.created_time
      }
      derived_column: user_sequence {
        sql: ROW_NUMBER() OVER (PARTITION BY user_id ORDER BY created_time) ;;
      }
    }
  }
  dimension: order_id {
    hidden: yes
  }
  dimension: user_sequence {
    type: number
  }
}
Creating derived columns for calculated values
You can add derived_column parameters to specify columns that don't exist in the explore_source parameter's Explore. Each derived_column parameter has a sql parameter that specifies how to construct the value.
Your sql calculation can use any columns that you have specified by using column parameters. Derived columns cannot include aggregate functions, but they can include calculations that can be performed on a single row of the table.
This example creates an average_customer_order column, which is calculated from the lifetime_customer_value and lifetime_number_of_orders columns in the native derived table.
view: user_order_facts {
  derived_table: {
    explore_source: order_items {
      column: user_id {
        field: users.id
      }
      column: lifetime_number_of_orders {
        field: order_items.count
      }
      column: lifetime_customer_value {
        field: order_items.total_profit
      }
      derived_column: average_customer_order {
        sql:  lifetime_customer_value / lifetime_number_of_orders ;;
      }
    }
  }

  dimension: user_id {
    hidden: yes
  }
  dimension: lifetime_number_of_orders {
    type: number
  }
  dimension: lifetime_customer_value {
    type: number
  }
  dimension: average_customer_order {
    type: number
  }
}
Optimization strategies
Because PDTs are stored in your database, you should optimize your PDTs by using the following strategies, as supported by your dialect:
For example, to add persistence, you could set the PDT to rebuild when the datagroup orders_datagroup triggers, and then you could add indexes on both customer_id and first_order, as shown next:
view: customer_order_summary {
  derived_table: {
    explore_source: orders {
      ...
    }
    datagroup_trigger: orders_datagroup
    indexes: ["customer_id", "first_order"]
  }
}
If you don't add an index (or an equivalent for your dialect), Looker will warn you that you should do so to improve query performance.
Using PDTs to test optimizations
You can use PDTs to test different indexing, distributions, and other optimization options without needing a large amount of support from your DBA or ETL developers.
Consider a case where you have a table but want to test different indexes. Your initial LookML for the view may look like the following:
view: customer {
  sql_table_name: warehouse.customer ;;
}
To test optimization strategies, you can use the indexes parameter to add indexes to the LookML, as shown next:
view: customer {
  # sql_table_name: warehouse.customer
  derived_table: {
    sql: SELECT * FROM warehouse.customer ;;
    persist_for: "8 hours"
    indexes: [customer_id, customer_name, salesperson_id]
  }
}
Query the view once to generate the PDT. Then run your test queries and compare your results. If your results are favorable, you can ask your DBA or ETL team to add the indexes to the original table.
UNION two tables
You can execute a SQL UNION or UNION ALL operator in both derived tables if your SQL dialect supports it. The UNION and UNION ALL operators combine the result sets of two queries.
This example shows what a SQL-based derived table looks like with a UNION:
view: first_and_second_quarter_sales {
  derived_table: {
    sql:
       SELECT * AS sales_records
       FROM sales_records_first_quarter
       UNION
       SELECT * AS sales_records
       FROM sales_records_second_quarter ;;
   }
}
The UNION statement in the sql parameter produces a derived table that combines the results of both queries.
The difference between UNION and UNION ALL is that UNION ALL does not remove duplicate rows. There are performance considerations to keep in mind when using UNION versus UNION ALL, as the database server must do additional work to remove the duplicate rows.
Taking a sum of a sum (dimensionalizing a measure)
As a general rule in SQL — and, by extension, Looker — you cannot group a query by the results of an aggregate function (represented in Looker as measures). You can only group by unaggregated fields (represented in Looker as dimensions).
To group by an aggregate (to take the sum of a sum, for example), you need to "dimensionalize" a measure. One way to do this is by using a derived table, which effectively creates a subquery of the aggregate.
Starting with an Explore, Looker can generate LookML for all or most of your derived table. Just create an Explore and select all the fields that you want to include in your derived table. Then, to generate the native (or SQL-based) derived table LookML, follow these steps:
Click the Explore's gear menu and select Get LookML.
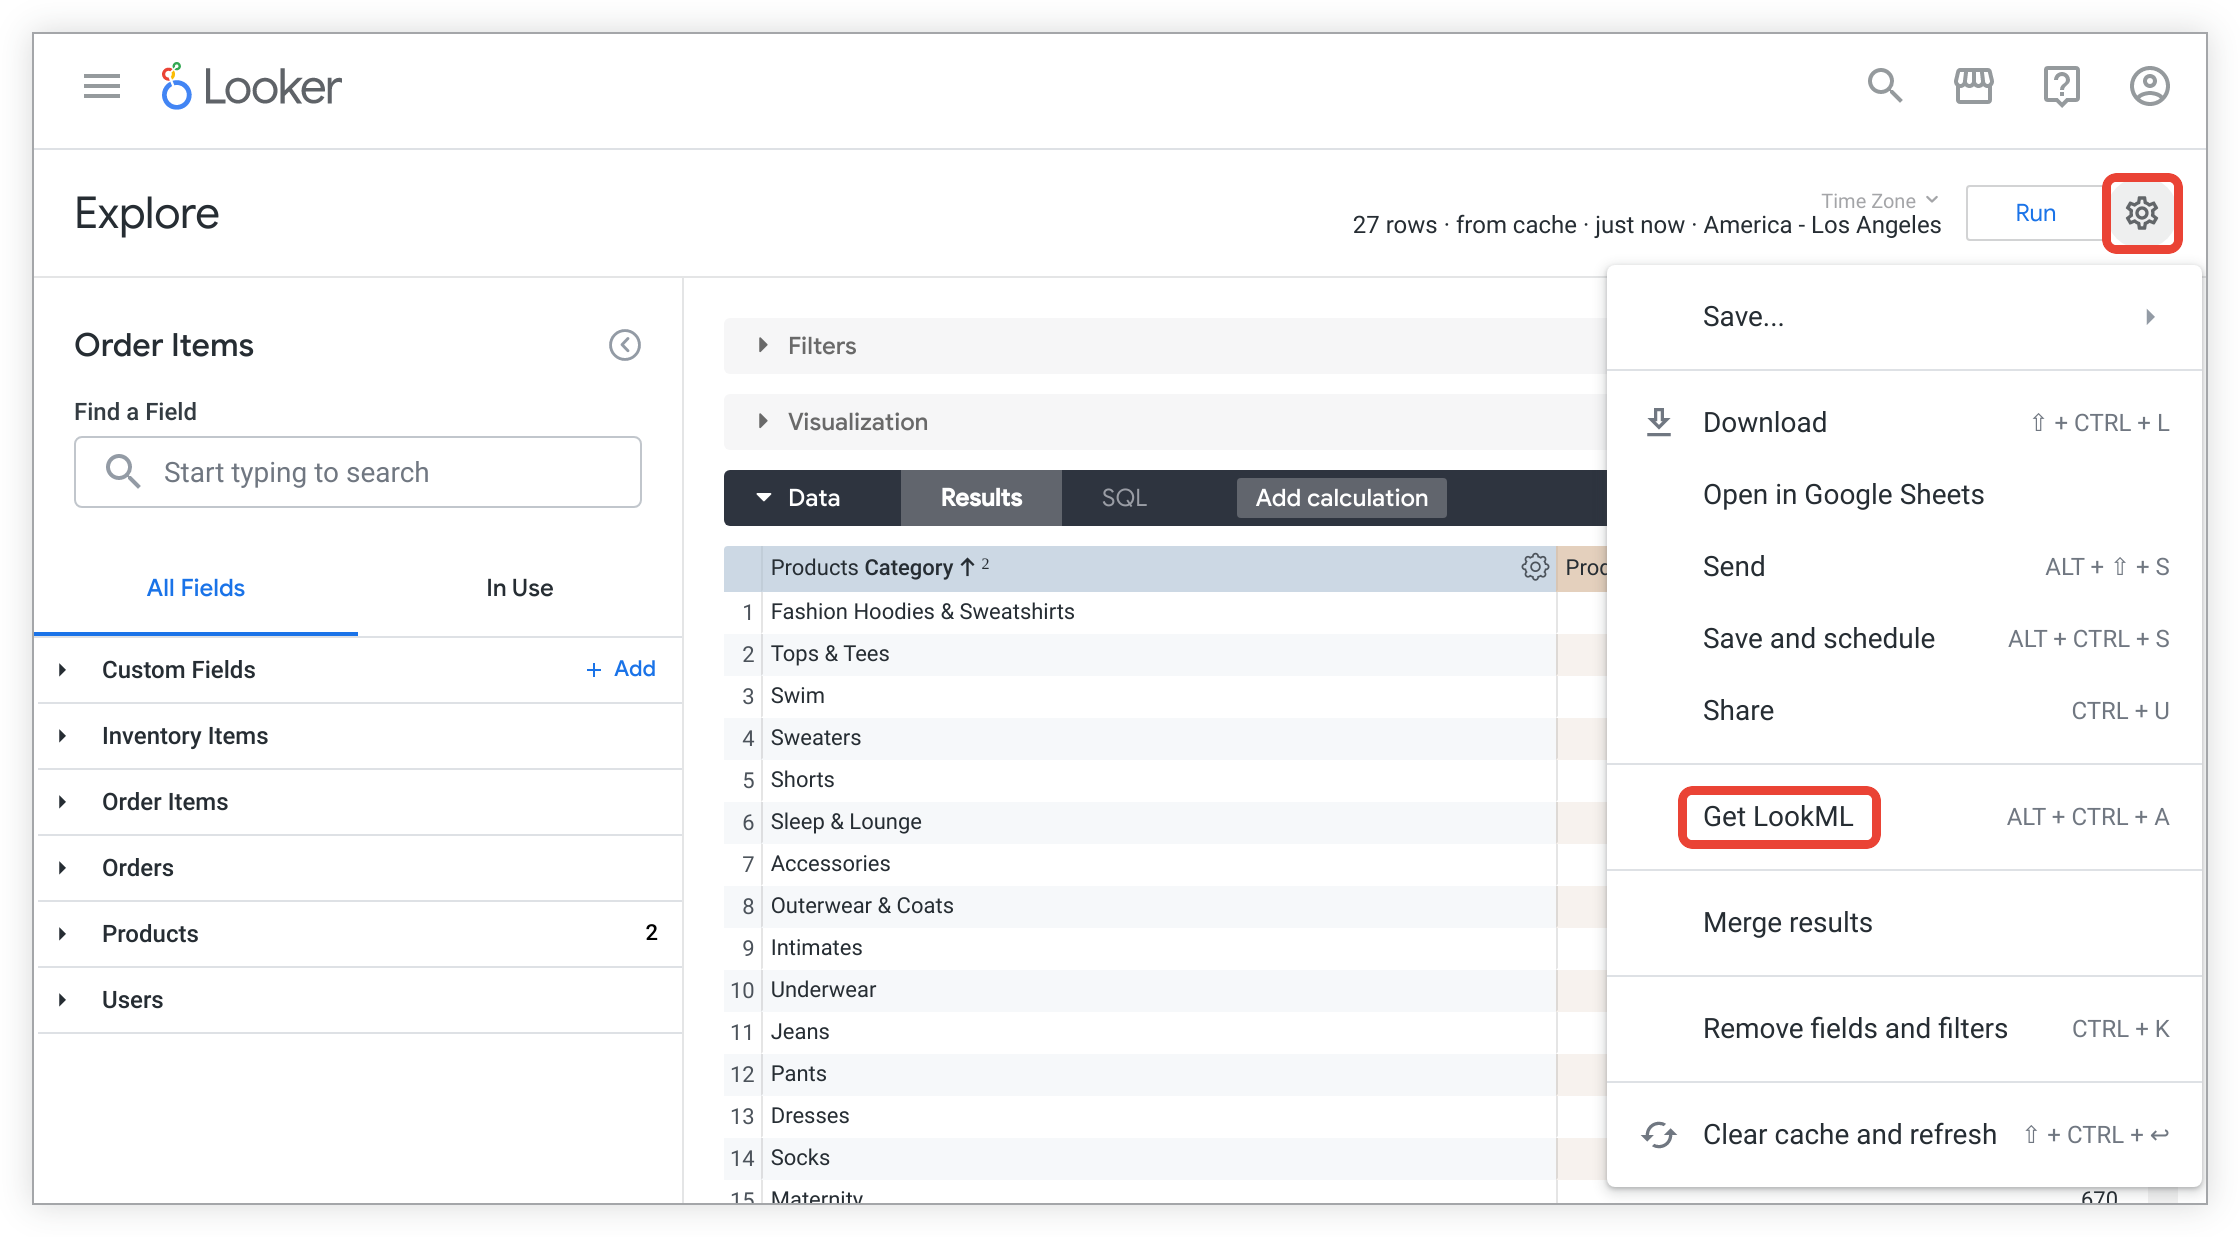
To see the LookML for creating a native derived table for the Explore, click the Derived Table tab.
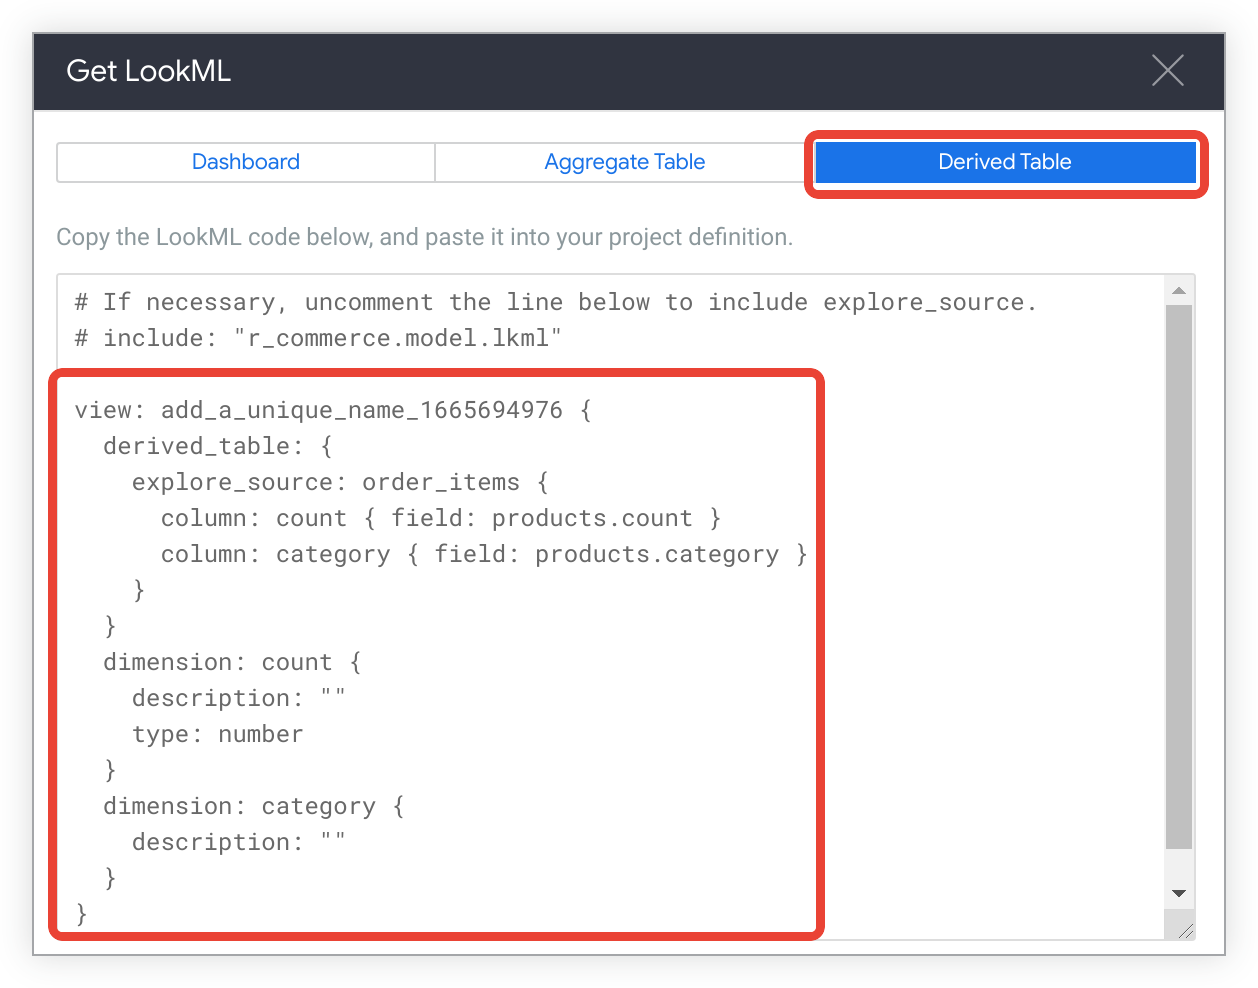
Copy the LookML.
Now that you have copied the generated LookML, paste it into a view file by following these steps:
In Development Mode, navigate to your project files.
Click the + at the top of the project file list in the Looker IDE, and select Create View. Alternatively, to create the file inside the folder, click a folder's menu and select Create View.
Set the view name to something meaningful.
Optionally, change column names, specify derived columns, and add filters.
Rollup tables with aggregate awareness
In Looker, you may often encounter very large datasets or tables that, in order to be performant, require aggregation tables or rollups.
With Looker's aggregate awareness, you can pre-construct aggregate tables to various levels of granularity, dimensionality, and aggregation; and you can inform Looker of how to use them within existing Explores. Queries will then use these rollup tables where Looker deems appropriate, without any user input. This will cut down query size, reduce wait times, and enhance user experience.
The following shows a very simple implementation in a Looker model to demonstrate how lightweight aggregate awareness can be. Given a hypothetical flights table in the database with a row for every flight that is recorded through the FAA, you can model this table in Looker with its own view and Explore. Following is the LookML for an aggregate table that you can define for the Explore:
  explore: flights {
    aggregate_table: flights_by_week_and_carrier {
      query: {
        dimensions: [carrier, depart_week]
        measures: [cancelled_count, count]
      }

      materialization: {
        sql_trigger_value: SELECT CURRENT-DATE;;
      }
    }
  }
With this aggregate table, a user can query the flights Explore, and Looker will automatically use the aggregate table to answer queries. For a more detailed walkthrough of aggregate awareness, visit the Aggregate awareness tutorial.