You can use shortcut calculations to perform common calculations on numeric fields that are in an Explore's data table without using Looker functions and operators when you have the permissions to create table calculations.
Calculating a percentage of the total for a given row in a table can help analysts see how one piece of data contributes to the whole. This page provides an overview of how to calculate percent of total calculations in Looker — for queries with and without pivoted dimensions.
Calculating percent of total for queries without pivoted dimensions
There are a few ways to calculate percent of total for query results that do not include pivoted dimensions:
Using table calculations
You can use table calculations to calculate a percent of total by dividing a row's value by the sum of its column: ${measure}/sum(${measure})
For example, the following Explore displays the Order Items Count grouped by Users State:
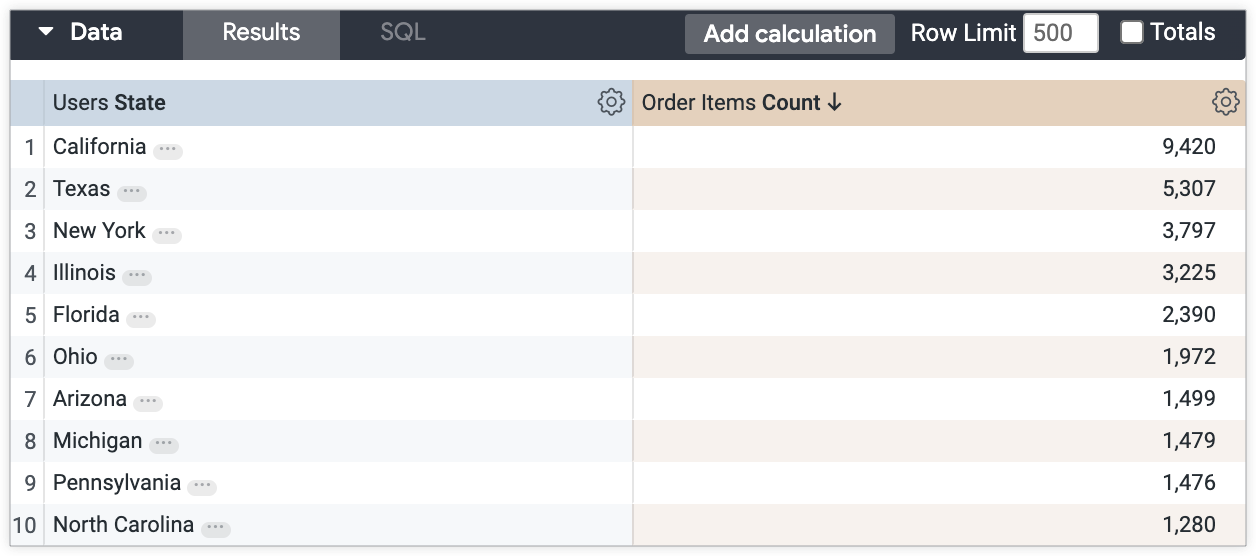
You can calculate the percent of total for each Order Items Count value by dividing by the sum of that column:
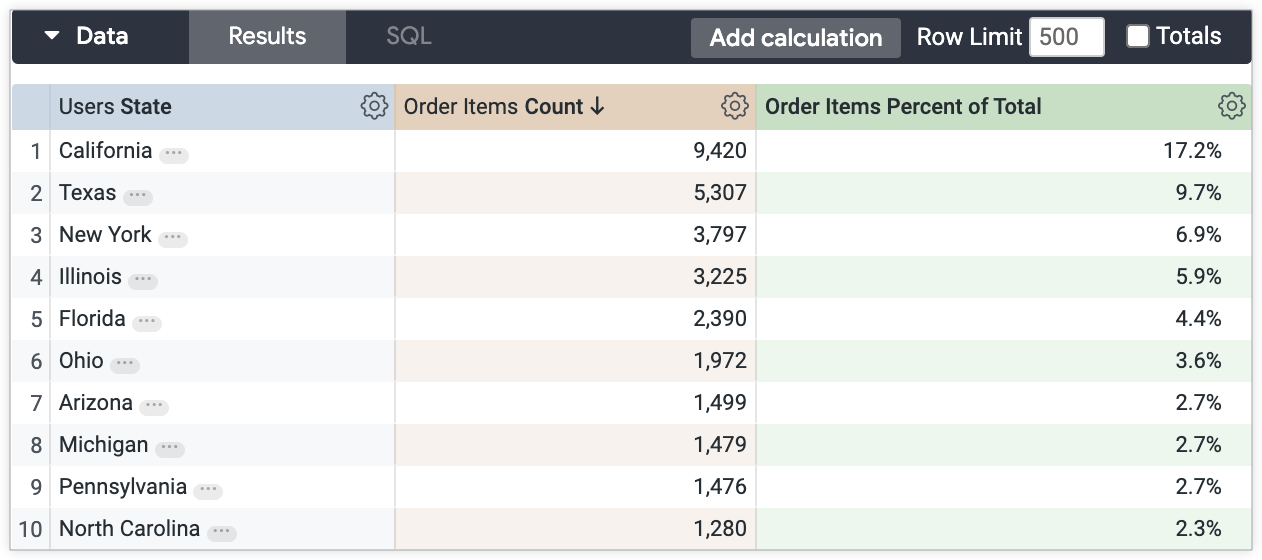
${order_items.count}/sum(${order_items.count})
The resulting percent of total table calculation will display percentages as a new column in the data table:
Using a pie chart visualization
You can also use a pie chart to display the percent of total without creating a table calculation. The percentages are listed in the legend alongside the fields to which they belong.
For example, the results of the preceding Explore example — Order Items Count grouped by Users City — are visualized in the following pie chart that displays the percent of total for each city's Order Items Count value in the legend:
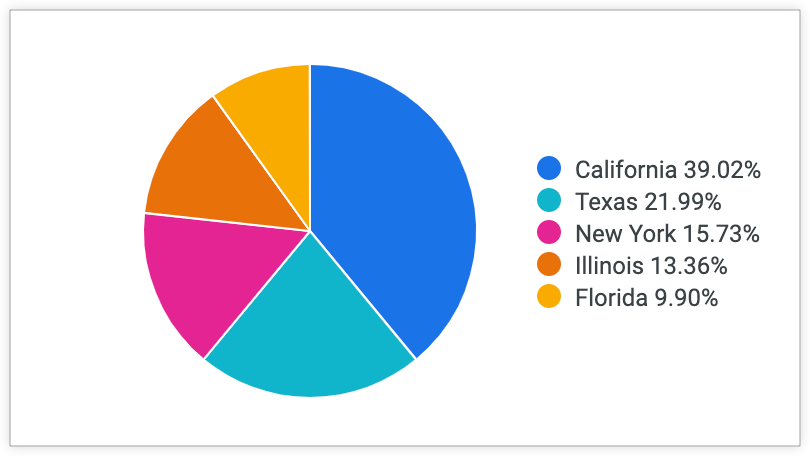
This method is valid if you are only using the visualization. A percent of total calculation will not be included in the Explore data table, and any downloaded results will not contain the percent of total.
Calculating percent of total for queries with pivots
There are also a few ways to calculate a percent of total across columns for Explores that do include pivoted dimensions:
Using table calculations
You can use table calculations to calculate a percent of total across pivoted columns by dividing a row's value by the sum of its row: sum(pivot_row(${measure}))/sum(sum(pivot_row(${measure})))
This calculation performs the following functions:
-
pivot_rowreturns the pivoted values of a row as a list. -
sum(pivot_row(${measure}))sums the list of pivoted values across a row to produce a row total. The row total is essentially its own column value. -
sum(sum(pivot_row(${measure})))produces the grand total of row values. -
sum(pivot_row(${measure}))/sum(sum(pivot_row(${measure})))is the final expression, dividing the row total by the grand row total to get the percent of total for that row.
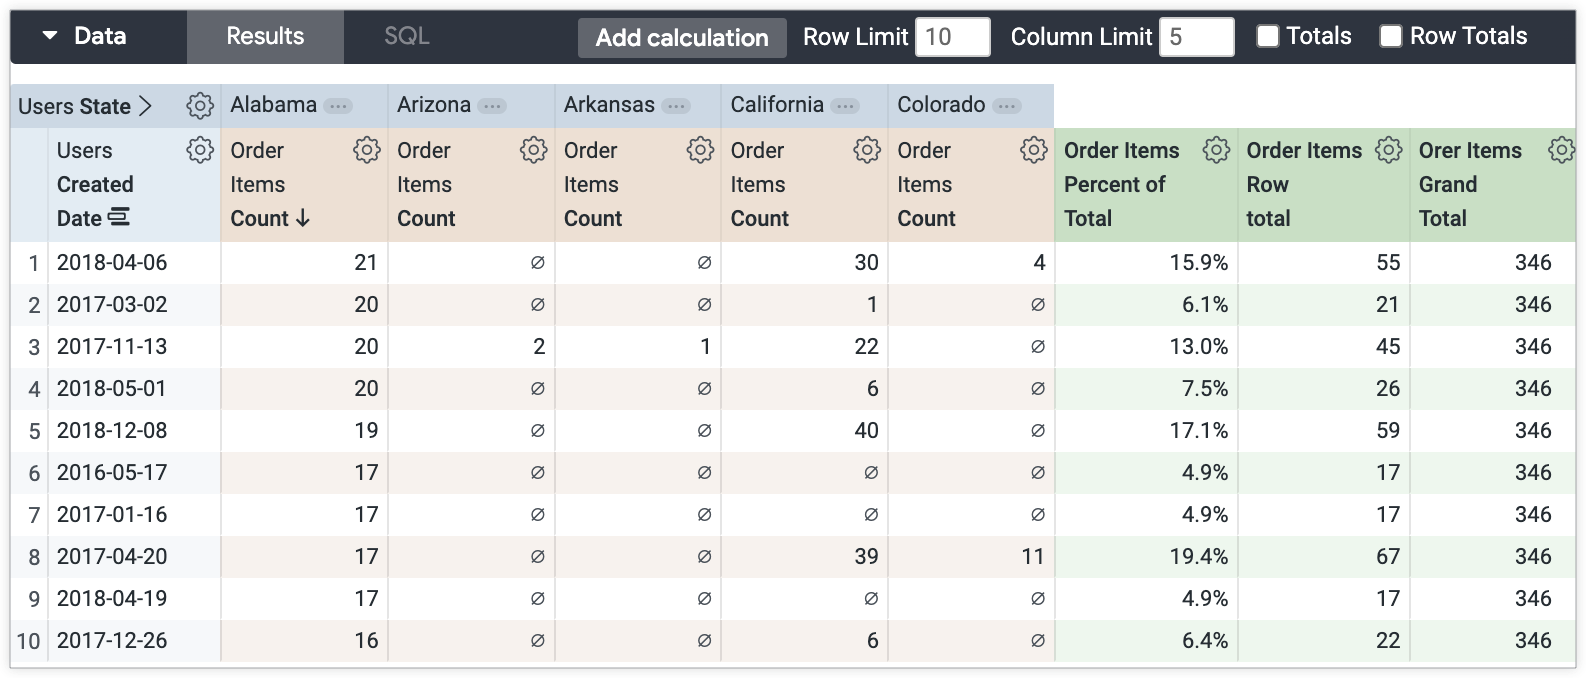
The following Explore — Order Items Count grouped by Users Created Date and pivoted by Users State — displays calculations for each part of the percent of total table calculation:
-
Order Items Row Total:
sum(pivot_row(${order_items.count})) -
Order Items Grand Total:
sum(sum(pivot_row(${order_items.count}))) -
Order Items Percent of Total:
sum(pivot_row(${order_items.count}))/sum(sum(pivot_row(${order_items.count})))
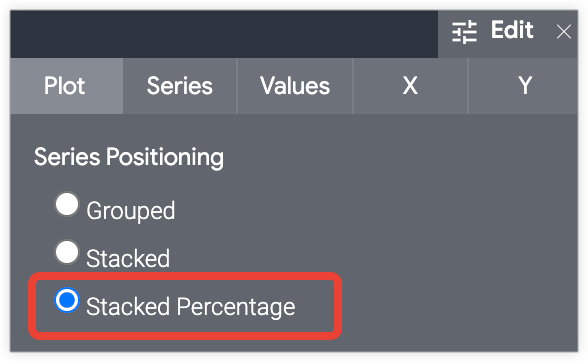
Using the Stacked Percentage visualization setting
If you only need the percent of total to be displayed in a visualization, you can use the Stacked Percentage Plot menu option to automatically display the percent of total for the following visualization types:
- Column
- Bar
- Scatterplot
- Line
- Area
Select the Stacked Percentage option in the Plot tab of the Edit menu on an Explore's Visualization bar:
Using the Stacked Percentage method for an Explore that displays values for Order Items Count grouped by Orders Created Year and pivoted by Users State results in the following column chart visualization. You can hover your cursor over each section of the column to see the percent of total for each order created date and age tier combination in the tooltip:
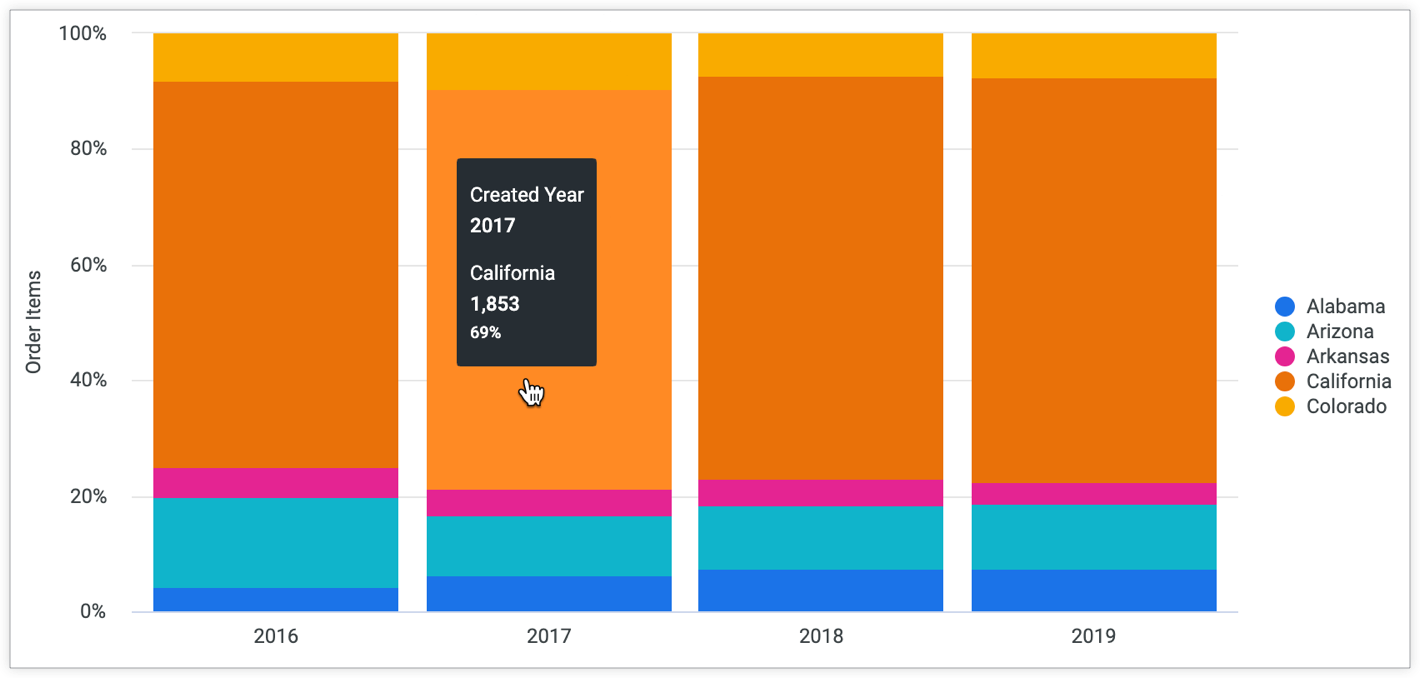
The information displayed in the tooltip will not be included in any static images or downloads of the chart. If you need to export the data or a static image of the chart, you can use the table calculation method or enable the Value Labels setting on the Values tab of the visualization Edit menu to display the percentages in the visualization:
