As a general rule in SQL — and, by extension, Looker — you cannot group a query by the results of an aggregate function (represented in Looker as measures). You can only group by unaggregated fields (represented in Looker as dimensions). If you try to aggregate a measure in Looker, you will see the following error:
Measures with Looker aggregations (sum, average, min, max, list types) may not reference other measures.
What if you need a way to change a measure (COUNT, SUM, AVG, MAX, etc.) into a dimension, so that you can group by it to aggregate it (like a SUM of a COUNT or an AVG of a SUM), filter by it (in the WHERE clause rather than a HAVING clause), or pivot on it in an Explore?
Using derived tables to dimensionalize a measure
Internally at Looker the solution is called dimensionalizing a measure. This is because you redefine a measure as a dimension. This is accomplished by creating a derived table that includes the measure you want to dimensionalize in its SQL definition.
The process
The following example is based on a sample e-commerce dataset. The goal for this example is
to create an type: average measure that is based on an existing Total Revenue type: sum measure.
The following steps outline how to generate a SQL-based derived table. You can elect to create a LookML-based derived table, also known as a native derived table (NDT), as an alternative to SQL.
-
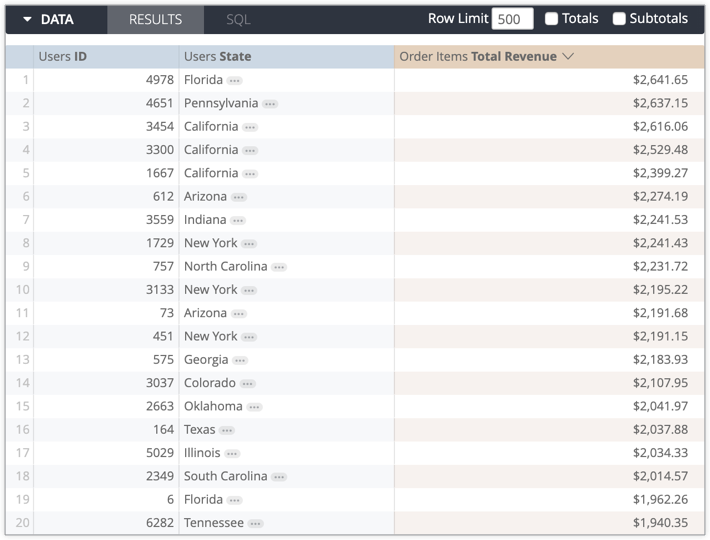
Start by setting up an Explore query.
Choose the appropriate fields, including the measure you want to dimensionalize.
In the example use case, the Explore Data table features Total Revenue grouped by Users State and Users ID:
-
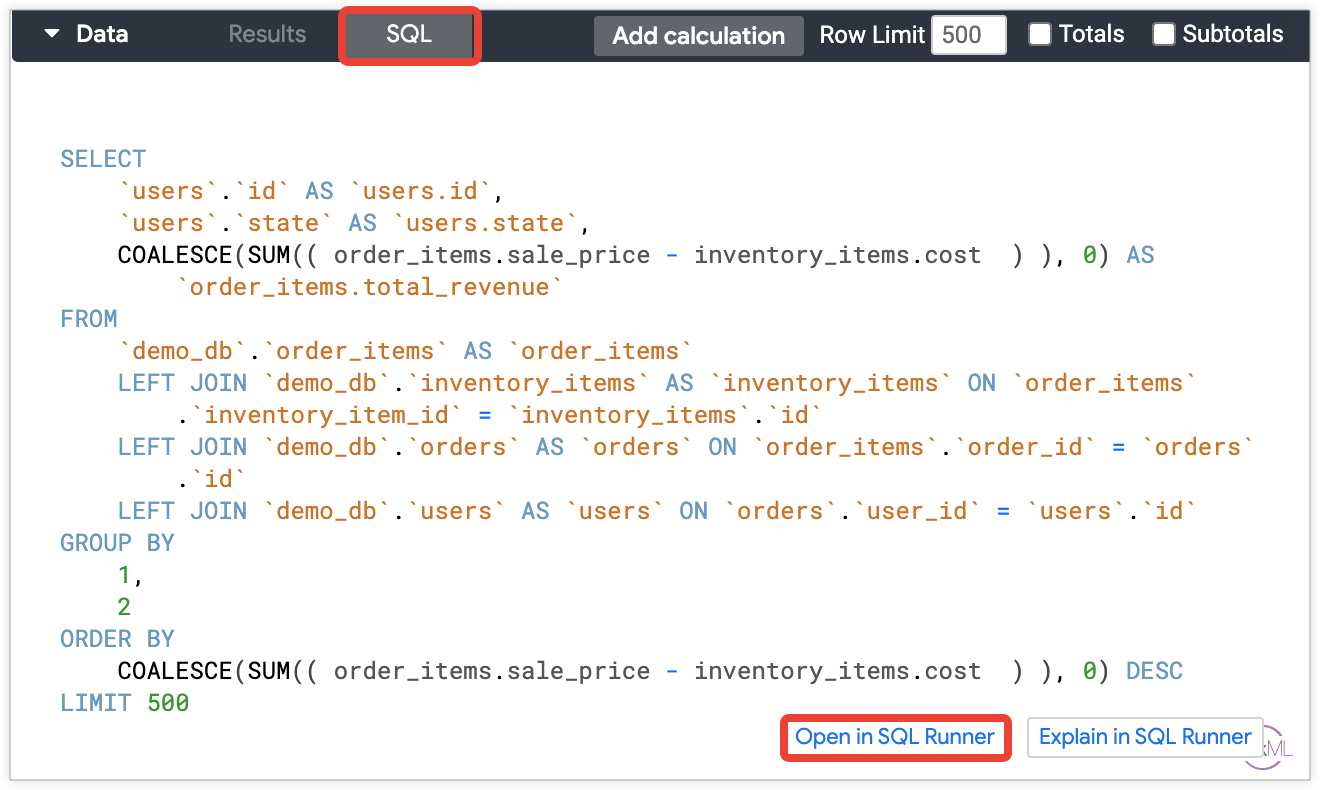
Choose Open in SQL Runner
from the SQL tab in the Data table to open the query in SQL Runner:
-
After running the query in SQL Runner (by clicking the Run button) and confirming the results,
choose the Add to Project option from the SQL Runner gear menu to open the Add to Project pop-up. At this point you need to remove any row limit clause in the derived
table SQL to ensure that all desired results are included in the query.
You can also choose Get Derived Table LookML from the menu to copy and paste the generated LookML into your project manually.
- From the Add to Project pop-up, select a project name from the Project drop-down, enter a name for your derived table view file, and select Add.
-
Now that the derived table is in a view file, you can create a measure
that aggregates the dimensionalized measure. For example, you can now create
a
type: averagemeasure for the new total revenue dimension,order_items_total_revenue:dimension: order_items_total_revenue { type: number sql: ${TABLE}.order_items.total_revenue ;; value_format_name: usd } measure: average_revenue { type: average sql: ${order_items_total_revenue} ;; value_format_name: usd } - Double-check that a primary key is defined in the derived table.
- Join the new view into the original Explore (or create a new Explore) to be able to create queries and content with the new fields.
Conclusion
Dimensionalizing measures with Looker derived tables unlocks new capabilities and provides the power to make further insights with your data. With the ability to group by a dimensionalized measure, filter by it in a WHERE clause (instead of HAVING), pivot on it, and create other dimensions based on it, you can take your Explore queries, and content, to the next dimension.
Visit the Derived tables documentation page for more information about creating and using derived tables, along with considerations and performance optimization tips.