Logs and metrics let you monitor your services and troubleshoot issues with service performance. You can view logs and metrics from Vertex AI services using the monitoring and logging resources from Google Distributed Cloud (GDC) air-gapped. You can also create queries to monitor specific Vertex AI metrics.
This page describes how to query and view logs and metrics from Vertex AI services in the monitoring instance of Distributed Cloud.
This page also contains sample queries that you can use to monitor the Vertex AI platform and services, such as Optical Character Recognition (OCR), Speech-to-Text, and Vertex AI Translation. For more information about logging and monitoring solutions in Distributed Cloud, see Monitor metrics and logs.
Before you begin
To get the permissions you need to view logs and metrics from
Vertex AI, ask your Project IAM Admin to grant you the
Project Grafana Viewer (project-grafana-viewer) role in your project
namespace.
For more information about this role, see Prepare IAM permissions.
Visualize logs and metrics in dashboards
You can view Vertex AI metrics and logs in dashboards. For example, you can create a query to view how Vertex AI affects CPU usage.
Follow these steps to view Vertex AI logs and metrics in dashboards:
In the navigation menu, click Vertex AI > Pre-trained APIs.
On the Pre-trained APIs page, make sure that the Vertex AI API for the service you want to monitor is enabled.
Click Monitor services in Grafana to open the Grafana home page.
In the navigation menu of the home page, click explore Explore to open the Explore page.
From the menu at the Explore page, select one of the following data sources:
- Operational Logs: retrieve operational logs.
- Audit Logs: retrieve audit logs.
- Prometheus: retrieve metrics.
If you want to display metrics, enter a query using PromQL (Prometheus Query Language) expressions.
If you want to display logs, enter a query using LogQL (Log Query Language) expressions.
The page displays the metrics or logs matching your query.
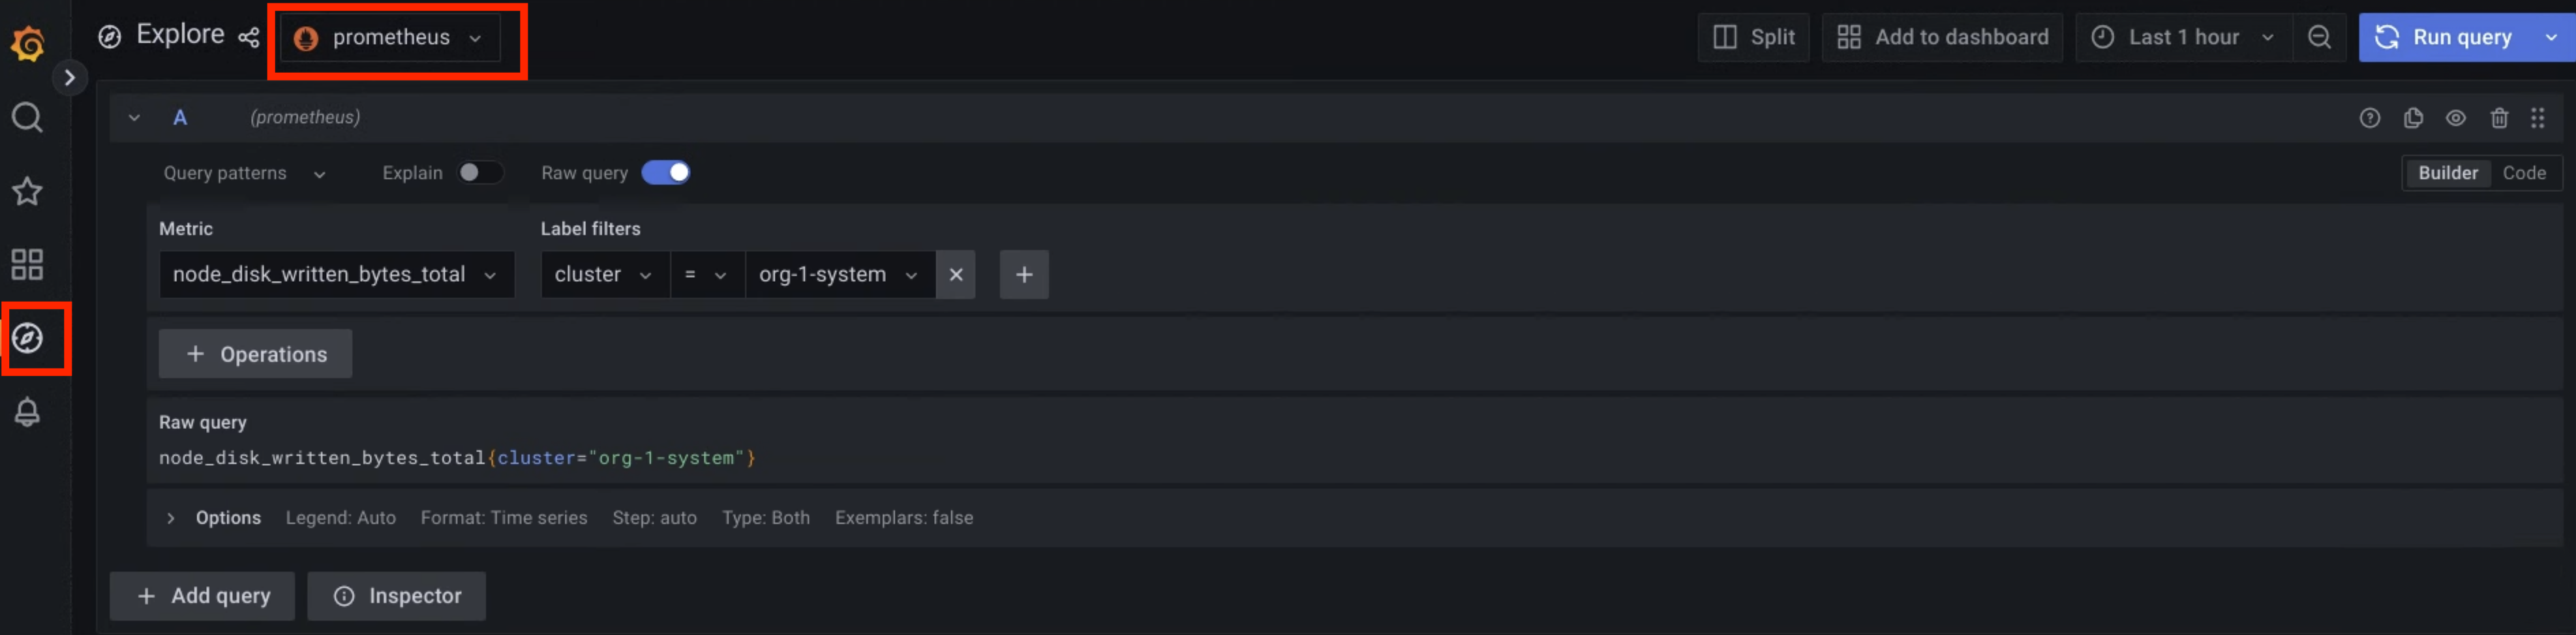
Figure 1. Menu option in Grafana to query metrics.
In figure 1, the Prometheus option displays the interface that lets you build queries to retrieve metrics.
Sample queries
The following table contains sample queries to monitor the Vertex AI platform in your environment:
| Vertex AI platform | |||
|---|---|---|---|
| Data source | Description | Component | Query |
| Metrics | CPU usage percentage of the container | Level 1 operator | rate(container_cpu_usage_seconds_total{namespace="ai-system",container="l1operator"}[30s]) * 100 |
| Level 2 operator | rate(container_cpu_usage_seconds_total{namespace="ai-system",container="l2operator"}[30s]) * 100 |
||
| Memory usage in MB of the container | Level 1 operator | container_memory_usage_bytes{namespace="ai-system",container="l1operator"} * 1e-6 |
|
| Level 2 operator | container_memory_usage_bytes{namespace="ai-system",container="l2operator"} * 1e-6 |
||
| Operational logs | L1 operator logs | Level 1 operator | {service_name="vai-l1operator"} |
| L2 operator logs | Level 2 operator | {service_name="vai-l2operator"} |
|
| Audit logs | Platform frontend audit logs | Vertex AI web plugin frontend | {service_name="istio"} |~ upstream_cluster:.*(vai-web-plugin-frontend) |
| Platform backend audit logs | Vertex AI web plugin backend | {service_name="istio"} |~ upstream_cluster:.*(vai-web-plugin-backend) |
|
The following table contains sample queries to monitor Vertex AI API services, such as OCR, Speech-to-Text, and Vertex AI Translation, in your environment:
| Vertex AI services | |||
|---|---|---|---|
| Data source | Description | Service | Query |
| Metrics | The effect of a pre-trained API on CPU usage. |
OCR | rate(container_cpu_usage_seconds_total{namespace="g-vai-ocr-sie",container="CONTAINER_NAME"}[30s]) * 100 CONTAINER_NAME values: vision-extractor | vision-frontend | vision-vms-ocr |
| Speech-to-Text | rate(container_cpu_usage_seconds_total{namespace="g-vai-speech-sie",container="CONTAINER_NAME"}[30s]) * 100 |
||
| Vertex AI Translation | rate(container_cpu_usage_seconds_total{namespace="g-vai-translation-sie",container="CONTAINER_NAME"}[30s]) * 100 CONTAINER_NAME values: translation-aligner | translation-frontend | translation-prediction |
||
Use the destination_service filter label to get the error rate over the last 60 minutes. |
OCR | rate(istio_requests_total{destination_service=~".*g-vai-ocr-sie.svc.cluster.local",response_code=~"[4-5][0-9][0-9]"}[60m]) |
|
| Speech-to-Text | rate(istio_requests_total{destination_service=~".*g-vai-speech-sie.svc.cluster.local",response_code=~"[4-5][0-9][0-9]"}[60m]) |
||
| Vertex AI Translation | rate(istio_requests_total{destination_service=~".*g-vai-translation-sie.svc.cluster.local",response_code=~"[4-5][0-9][0-9]"}[60m]) |
||
| Operational logs | Operational logs from Vertex AI services |
OCR | {namespace="g-vai-ocr-sie"} |
| Speech-to-Text | {namespace="g-vai-speech-sie"} |
||
| Vertex AI Translation | {namespace="g-vai-translation-sie"} |
||
| Audit logs | Audit logs from Vertex AI services | OCR | {service_name="istio"} |= "vision-frontend-server" |
| Speech-to-Text | {service_name="istio"} |= "speech-frontend-server" |
||
| Vertex AI Translation | {service_name="istio"} |= "translation-frontend-server" |
||