This guide covers conceptual context required to deploy a virtual machine (VM) based workload into a Google Distributed Cloud (GDC) air-gapped cluster on bare metal using a VM runtime. The workload in this guide is a sample ticketing system platform that is available on on-premises hardware.
Architecture
Resource hierarchy
In GDC, you deploy the components that make up the ticketing system in a dedicated tenant organization for the Operations team, identical to any customer organization. An organization is a collection of clusters, infrastructure resources, and application workloads that are administered together. Each organization in a GDC instance uses a dedicated set of servers, providing strong isolation between tenants. For more information about infrastructure, see Design access boundaries.
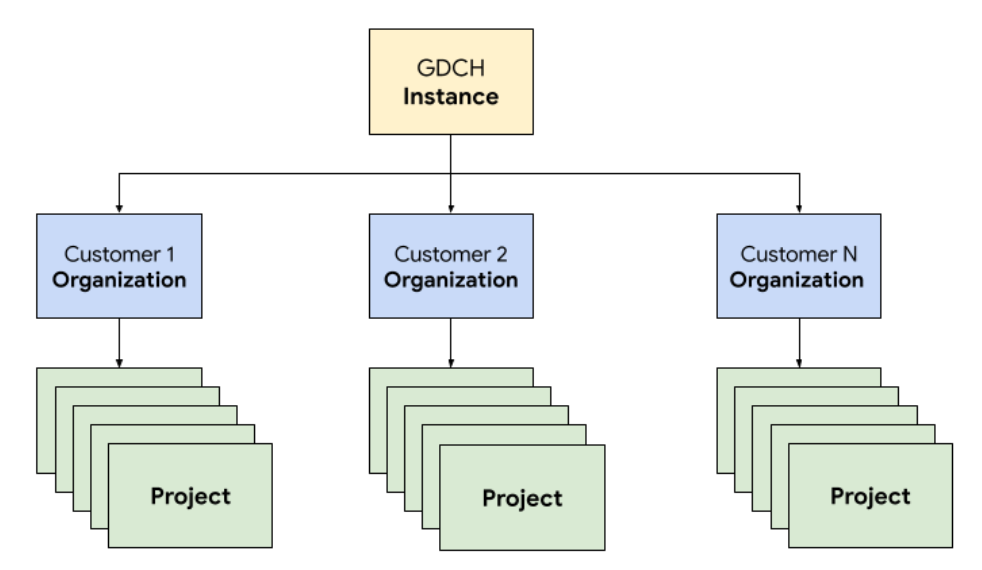
Additionally, you deploy and manage the ticketing system resources together in a project, which provides logical isolation within an organization using software policies and enforcement. Resources in a project are meant to couple components that must remain together for their lifecycle.
The ticketing system follows a three-tier architecture relying on a load balancer to direct traffic across application servers that connect to a database server that stores persistent data.
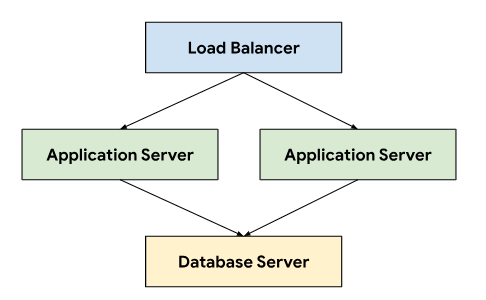
This architecture allows for scalability and maintainability, as each tier can be independently developed and maintained. It also provides a clear separation of concerns, which simplifies debugging and troubleshooting. Encapsulating these tiers within a GDC project lets you deploy and manage components together, for example, your application and database servers.
Networking
Running the ticketing system in a production environment requires deploying two or more application servers to achieve high availability in case of node failure. Combined with a load balancer, this topology also allows distributing load across multiple machines to horizontally scale the application. The Kubernetes-native platform of GDC utilizes Cloud Service Mesh to securely route traffic to the application servers that make up the ticketing system.
Cloud Service Mesh is a Google's implementation based on the open source project that manages, observes, and secures services. The following features of Cloud Service Mesh are leveraged to host the ticketing system on GDC:
- Load balancing: Cloud Service Mesh decouples traffic flow from infrastructure scaling, opening up many traffic management features, including dynamic request routing. The ticketing system requires persistent client connections, so we enable sticky sessions using
DestinationRulesto configure traffic routing behavior.
TLS termination: Cloud Service Mesh exposes ingress gateways using TLS certificates and provides transport authentication within the cluster through mTLS (Mutual Transport Layer Security) without having to change any application code.
Failure recovery: Cloud Service Mesh provides a number of critical failure-recovery features, including timeouts, circuit breakers, active health checks, and bounded retries.
Within the Kubernetes cluster, we use standard Service objects as an abstract way to expose the application and database servers to the network. Services provide a convenient way to target instances using a selector and provide name resolution within the cluster using a cluster-aware DNS server.
apiVersion: v1
kind: Service
metadata:
  name: http-ingress
spec:
  selector:
    app.kubernetes.io/component: application-server
  ports:
  - name: http
    port: 80
---
apiVersion: v1
kind: Service
metadata:
  name: database-ingress
spec:
  selector:
    app.kubernetes.io/component: database-server
  ports:
  - name: mysql
    port: 3306
Compute
The ticketing system recommends using either bare metal or virtual machines to host on-premise installations, and we utilized GDC virtual machine (VM) management to deploy both the application and database servers as VM workloads. Defining Kubernetes resources allowed us to specify both the VirtualMachine and VirtualMachineDisk to tailor resources to meet our needs for the different types of servers. VirtualMachineExternalAccess lets us to configure data transfer in and data transfer out for the VM.
apiVersion: virtualmachine.gdc.goog/v1
kind: VirtualMachineDisk
metadata:
  name: vm1-boot-disk
spec:
  size: 100G
  source:
    image:
      name: ts-ticketing-system-app-server-2023-08-18-203258
      namespace: vm-system
---
apiVersion: virtualmachine.gdc.goog/v1
kind: VirtualMachine
metadata:
  labels:
    app.kubernetes.io/component: application-server
  name: vm1
  namespace: support
spec:
  compute:
    vcpus: 8
    memory: 12G
  disks:
  - boot: true
    virtualMachineDiskRef:
      name: vm1-boot-disk

---
apiVersion: virtualmachine.gdc.goog/v1
kind: VirtualMachineExternalAccess
metadata:
  name: vm1
  namespace: support
spec:
  enabled: true
  ports:
   - name: ssh
     protocol: TCP
     port: 22
For the guest OS image, we created a custom image to meet our requirements for
compliance and security. Connecting to running VM instances is possible over
SSH using the VirtualMachineAccessRequest, which allows us to limit the
ability to connect to VMs through Kubernetes RBAC and avoid the need to create
local user accounts in the custom images. The access request also defines a
time to live (TTL) allowing time-based access requests to manage the VMs that
expire automatically.
Automation
As a key deliverable for this project, we designed an approach to install instances of the ticketing system in a repeatable fashion that can support extensive automation and reduce configuration drift between deployments.
Release Pipeline
Customizing the application and database server images starts from a base operating system image, modifying the base image as necessary to install dependencies needed for each server image. We selected a base OS image for its widespread adoption hosting ticketing systems in on-premise installations. This base OS image also provides security hardening capabilities required to meet Security Technical Implementation Guides (STIGs) needed to deliver a compliant image that meets NIST-800-53 controls.
Our continuous integration (CI) pipeline used the following workflow to customize application and database server images:
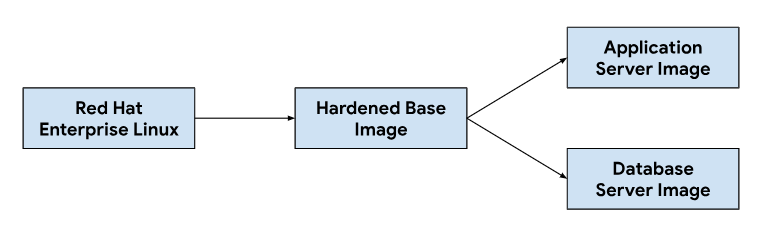
When developers make changes to the customization scripts or image dependencies, we trigger an automated workflow in our CI tooling to generate a new set of images that get bundled with GDC releases. As part of image building, we also refresh OS dependencies (yum update) and sparsify the image with compression to reduce the image size needed to transfer images to customer environments.
Software development lifecycle
The software development lifecycle (SDLC) is a process that helps organizations plan, create, test, and deploy software. By following a well-defined SDLC, organizations ensure that software is developed in a consistent and repeatable manner and identify potential problems early on. In addition to building images in our continuous integration (CI) pipeline, we also defined environments to develop and stage pre-release versions of the ticketing system for testing and quality assurance.
Deploying a separate instance of the ticketing system per GDC project allowed us to test changes in isolation, without affecting existing instances on the same GDC instance. We used the ResourceManager API to declaratively create and tear down Projects using Kubernetes resources.
apiVersion: resourcemanager.gdc.goog/v1
kind: Project
metadata:
  name: ticketing-system-dev
---
apiVersion: resourcemanager.gdc.goog/v1
kind: Project
metadata:
  name: ticketing-system-qa
---
apiVersion: resourcemanager.gdc.goog/v1
kind: Project
metadata:
  name: ticketing-system-staging
Combined with chart packaging and managing infrastructure like virtual machines as code, developers can quickly iterate making changes and testing new features alongside production instances. The declarative API also makes it possible for automated test execution frameworks to perform regular regression testing and verify existing capabilities.
Operability
Operability is the ease with which a system can be operated and maintained. It is an important consideration in the design of any software application. Effective monitoring contributes to operability because it allows problems to be identified and addressed before they have a significant impact on the system. Monitoring can also be used to identify opportunities for improvement and establish a baseline for service level objectives (SLO).
Monitoring
We integrated the ticketing system with existing GDC observability infrastructure, including logging and metrics. For metrics, we expose HTTP endpoints from each VM that allows the application to scrape data points produced by the application and database servers. These endpoints include system metrics collected using the application node exporter and application-specific metrics.
With endpoints exposed in each VM, we configured the application polling
behavior using the MonitoringTarget custom resource to define the scrape
interval and annotate the metrics.
apiVersion: monitoring.gdc.goog/v1
kind: MonitoringTarget
metadata:
  name: database-monitor
spec:
  podMetricsEndpoints:
    path:
      value: /metrics
    port:
      annotation: application.io/dbMetrics
    scrapeInterval: 60s
For logging, we installed and configured a logging and metrics processor in
each VM to tail relevant logs and send log data to the logging tool, where the
data is indexed and queried through the monitoring instance. Audit logs are
forwarded to a special endpoint configured with extended retention for
compliance. Container-based applications can use the LoggingTarget and
AuditLoggingTarget custom resource to instruct the logging pipeline to
collect logs from specific services in your project.
Based on data available in the logging and monitoring processors, we created
alerts using the MonitoringRule custom resource, which allows us to manage
this configuration as code in our chart packaging. Using a declarative API to
define alerts and dashboards also lets us store this configuration in our code
repository and follow the same code review and continuous integration processes
we rely on for any other code changes.
Failure Modes
Early testing uncovered several resource-related failure modes that helped us prioritize which metrics and alerts to add first. We started with monitoring high memory and disk usage, since database misconfiguration initially led to buffer tables consuming all available memory and over-logging filled the attached persistent volume disk. After adjusting the storage buffer size and implementing a log rotation strategy, we then introduced alerts that run if the VMs approach high memory or disk usage.
apiVersion: monitoring.gdc.goog/v1
kind: MonitoringRule
metadata:
  name: monitoring-rule
spec:
  interval: 60s
  limit: 0
  alertRules:
  - alert: vm1_disk_usage
    expr:
      (node_filesystem_size_bytes{container_name="compute"} -
      node_filesystem_avail_bytes{container_name="compute"}) * 100 /
      node_filesystem_size_bytes{container_name="compute"} > 90
    labels:
      severity: error
      code: <a href="/distributed-cloud/hosted/docs/latest/gdch/gdch-io/service-manual/ts/runbooks/ts-r0001">TS-R0001</a>
      resource: vm1
    annotations:
      message: "vm1 disk usage above 90% utilization"
After verifying system stability, we shifted our focus to application failure modes within the ticketing system. Since debugging issues within the application often required us to use secure shell (SSH) into each application server VM to check the ticketing system logs, we configured an application to forward these logs to the logging tool to build on the GDC observability stack and query all of the ticketing system operational logs in the monitoring instance.
Centralized logging also enabled us to query logs from multiple VMs at the same time, consolidating our view of each component of the system.
Backups
Backups are important for the operability of a software system because they
let the system to be restored in the event of a failure.
GDC offers VM backup and restore through
Kubernetes resources. Creating a VirtualMachineBackupRequest custom resource
with a VirtualMachineBackupPlanTemplate custom resource lets us back up the
persistent volume attached to each VM to object storage, where the backups can
be retained following a retention policy set.
apiVersion: virtualmachine.gdc.goog/v1
kind: VirtualMachineBackupPlanTemplate
metadata:
  name: vm-backup-plan
spec:
  backupRepository: "backup-repository"
---
apiVersion: virtualmachine.gdc.goog/v1
kind: VirtualMachineBackupRequest
metadata:
  name: "db-vm-backup"
spec:
  virtualMachineBackupPlanTemplate: vm-backup-plan
  virtualMachine: db1
  virtualMachineBackupName: db-vm-backup
Similarly, restoring a VM state from backup involves creating a
VirtualMachineRestoreRequest custom resource, to restore both application and
database servers without modifying the code or configuration for either
service.
apiVersion: virtualmachine.gdc.goog/v1
kind: VirtualMachineRestoreRequest
metadata:
  name: vm-restore-1
spec:
  virtualMachineBackup: db-vm-backup
  restoreName: restore1
  restoredResourceName: db1
Upgrades
To support the software lifecycle of the ticketing system and its dependencies, we identified three types of software upgrades, each handled individually to minimize downtime and service disruption:
- OS upgrades.
- Platform upgrades, such as patch and major versions.
- Configuration updates.
For OS upgrades we continuously build and release new VM images for both application and database servers that get distributed with each GDC release. These images contain fixes for security vulnerabilities and updates to the underlying operating system.
The ticketing system platform upgrades require applying updates to the existing VM images, so we cannot rely on immutable infrastructure to perform patching and major release version updates. For platform upgrades, we test and verify the patch or major release version in our development and staging environments before releasing a standalone upgrade package together with the GDC release.
Lastly, configuration updates are applied without downtime through the ticketing system APIs for update sets and other user data. We develop and test configuration updates in our development and staging environments before packaging multiple update sets together during the GDC release process.
Integrations
Identity Providers
To provide customers with a seamless journey and enable organizations to onboard their users, we integrate the ticketing system with multiple identity providers available in GDC. Typically, enterprise and public sector customers have their own well-managed identity providers for granting and revoking entitlement to their employees. Due to compliance requirements and ease of identity and access governance, these customers want to use their existing identity providers as the source of truth to manage their employees access to the ticketing system.
The ticketing system supports both SAML 2.0 and OIDC providers through its multi-identity provider module, which we pre-enabled in our application server VM image. Customers authenticate through their organization identity provider, which automatically creates users and assigns roles within the ticketing system.
Egress to identity provider servers is allowed through the
ProjectNetworkPolicy custom resource, which limits if external services are
reachable from an organization in GDC. These policies
let us declaratively control which endpoints the ticketing system can access
on the network.
Alert ingestion
In addition to letting users sign in to manually create support cases, we also create ticketing system incidents in response to system alerts.
To achieve this integration, we customized an open source Kubernetes webhook to receive alerts from the application and manage the lifecycle of incidents using the ticketing system API endpoint exposed through Cloud Service Mesh.
API keys are stored using the GDC secret store, backed by Kubernetes secrets controlled through role-based access control (RBAC). Other configurations such as API endpoints and incident customization fields are managed through Kubernetes ConfigMap key-value storage.
The ticketing system offers mail server integrations to allow customers to receive email-based support. Automated workflows convert inbound customer emails to support cases and send auto-replies to customers with case links, enabling our support team to better manage their inbox, systematically track and resolve email requests, and provide better customer service.
apiVersion: networking.gdc.goog/v1
kind: ProjectNetworkPolicy
metadata:
  name: allow-ingress-traffic-from-ticketing-system
spec:
  subject:
    subjectType: UserWorkload
  ingress:
  - from:
    - projects:
        matchNames:
        - ticketing-system
Exposing email as a Kubernetes service also provides service discovery and domain name resolution and further decouples the email server backend from clients like the ticketing system.
Compliance
Audit Logging
Audit logs contribute to compliance posture by providing a way to track and monitor software usage and provide a record of system activity. Audit logs record access attempts by unauthorized users, track API usage, and identify potential security risks. Audit logs meet compliance requirements, such as those imposed by the Health Insurance Portability and Accountability Act (HIPAA), Payment Card Industry Data Security Standard (PCI DSS), and Sarbanes-Oxley Act (SOX).
GDC provides a system to record administrative
activities and accesses within the platform and retain these logs for a
configurable period of time. Deploying the AuditLoggingTarget custom resource
configures the logging pipeline to collect audit logs from our application.
For the ticketing system, we configured audit logging targets for both system audit events collected, and application-specific events generated by the ticketing system security audit log. Both types of logs are sent to a centralized Loki instance where we can write queries and view dashboards in the monitoring instance.
Access control
Access control is the process of granting or denying access to resources based on the identity of the user or process requesting access. This helps to protect the data from unauthorized access and to ensure that only authorized users can make changes to the system. In GDC, we rely on Kubernetes RBAC to declare policies and enforce authorization to the system resources that consist of the ticketing system application.
Defining a ProjectRole in GDC lets us grant
fine-grained access to Kubernetes resources using a preset authorization role.
apiVersion: resourcemanager.gdc.goog/v1
kind: ProjectRole
metadata:
  name: ticketing-system-admin
  labels:
    resourcemanager.gdc.goog/rbac-selector: system
spec:
  rules:
  - apiGroups:
    - ""
    resources:
    - configmaps
    - events
    - pods/log
    - services
    verbs:
    - get
    - list
Disaster recovery
Database replication
To meet disaster recovery (DR) requirements, we deploy the ticketing system in a primary-secondary configuration across multiple GDC instances. In this mode, requests to the ticketing system are normally routed to the primary site, while the secondary site continuously replicates the binary log of the database. In the event of a failover event, the secondary site is promoted to become the new primary site and requests are then routed to the new primary.
We build on database replication capabilities to configure both the primary and replica database servers per GDC instance based on parameters set.
To enable replication for an existing instance that has been running longer than the retention period for the binary log, we can restore the replica database using database backup to begin replication from the primary database.
In primary mode, the application servers and database operate the same as today, but the primary database is configured to enable replication. For example:
Enable the binary log.
Set the server ID.
Create a replication user account.
Create a backup.
In replica mode, the application servers will disable the ticketing web service to avoid connecting directly to the replica database. The replica database must be configured to start replication from the primary database, for example:
Set the server ID.
Configure the replication user credentials and primary connection details, such as the host and port.
Restore from backup resume binary log position.
Database replication requires network connectivity for the replica to connect to the primary database to start replication. To expose the primary database endpoint for replication, we use Cloud Service Mesh to create an Ingress service mesh that supports TLS termination at the service mesh, similar to how we handle HTTPS data transfer in for the ticketing system web application.