The metrics dashboard of the Managed Harbor Service (MHS) component provides graphs and visualization panels for viewing storage consumption and the number of vulnerability scans performed.
Open the following URL to access the user cluster health dashboard:
https://GDC_URL/platform-obs/grafana/d/haas-billing/haas-billing-dashboard?orgId=ORG_ID
Replace the following:
GDC_URL: the URL of your organization in Google Distributed Cloud (GDC) air-gapped.ORG_ID: the ID for your organization in GDC.
View the MHS metrics dashboard
In this dashboard, you can gain valuable insights for your Harbor instances, such as the following:
- The number of Harbor vulnerability scans performed.
- The amount of object storage capacity used.
- The number of Harbor projects.
Use the Harbor Vulnerability Scans panel to view the number of vulnerability scans you are performing for your Harbor instances.
Use the Object Storage Used Capacity panel to view storage consumption metrics and measure the amount of object storage resources you are using.
Use the Harbor Projects panel to view the count of all Harbor projects in the Harbor instance.
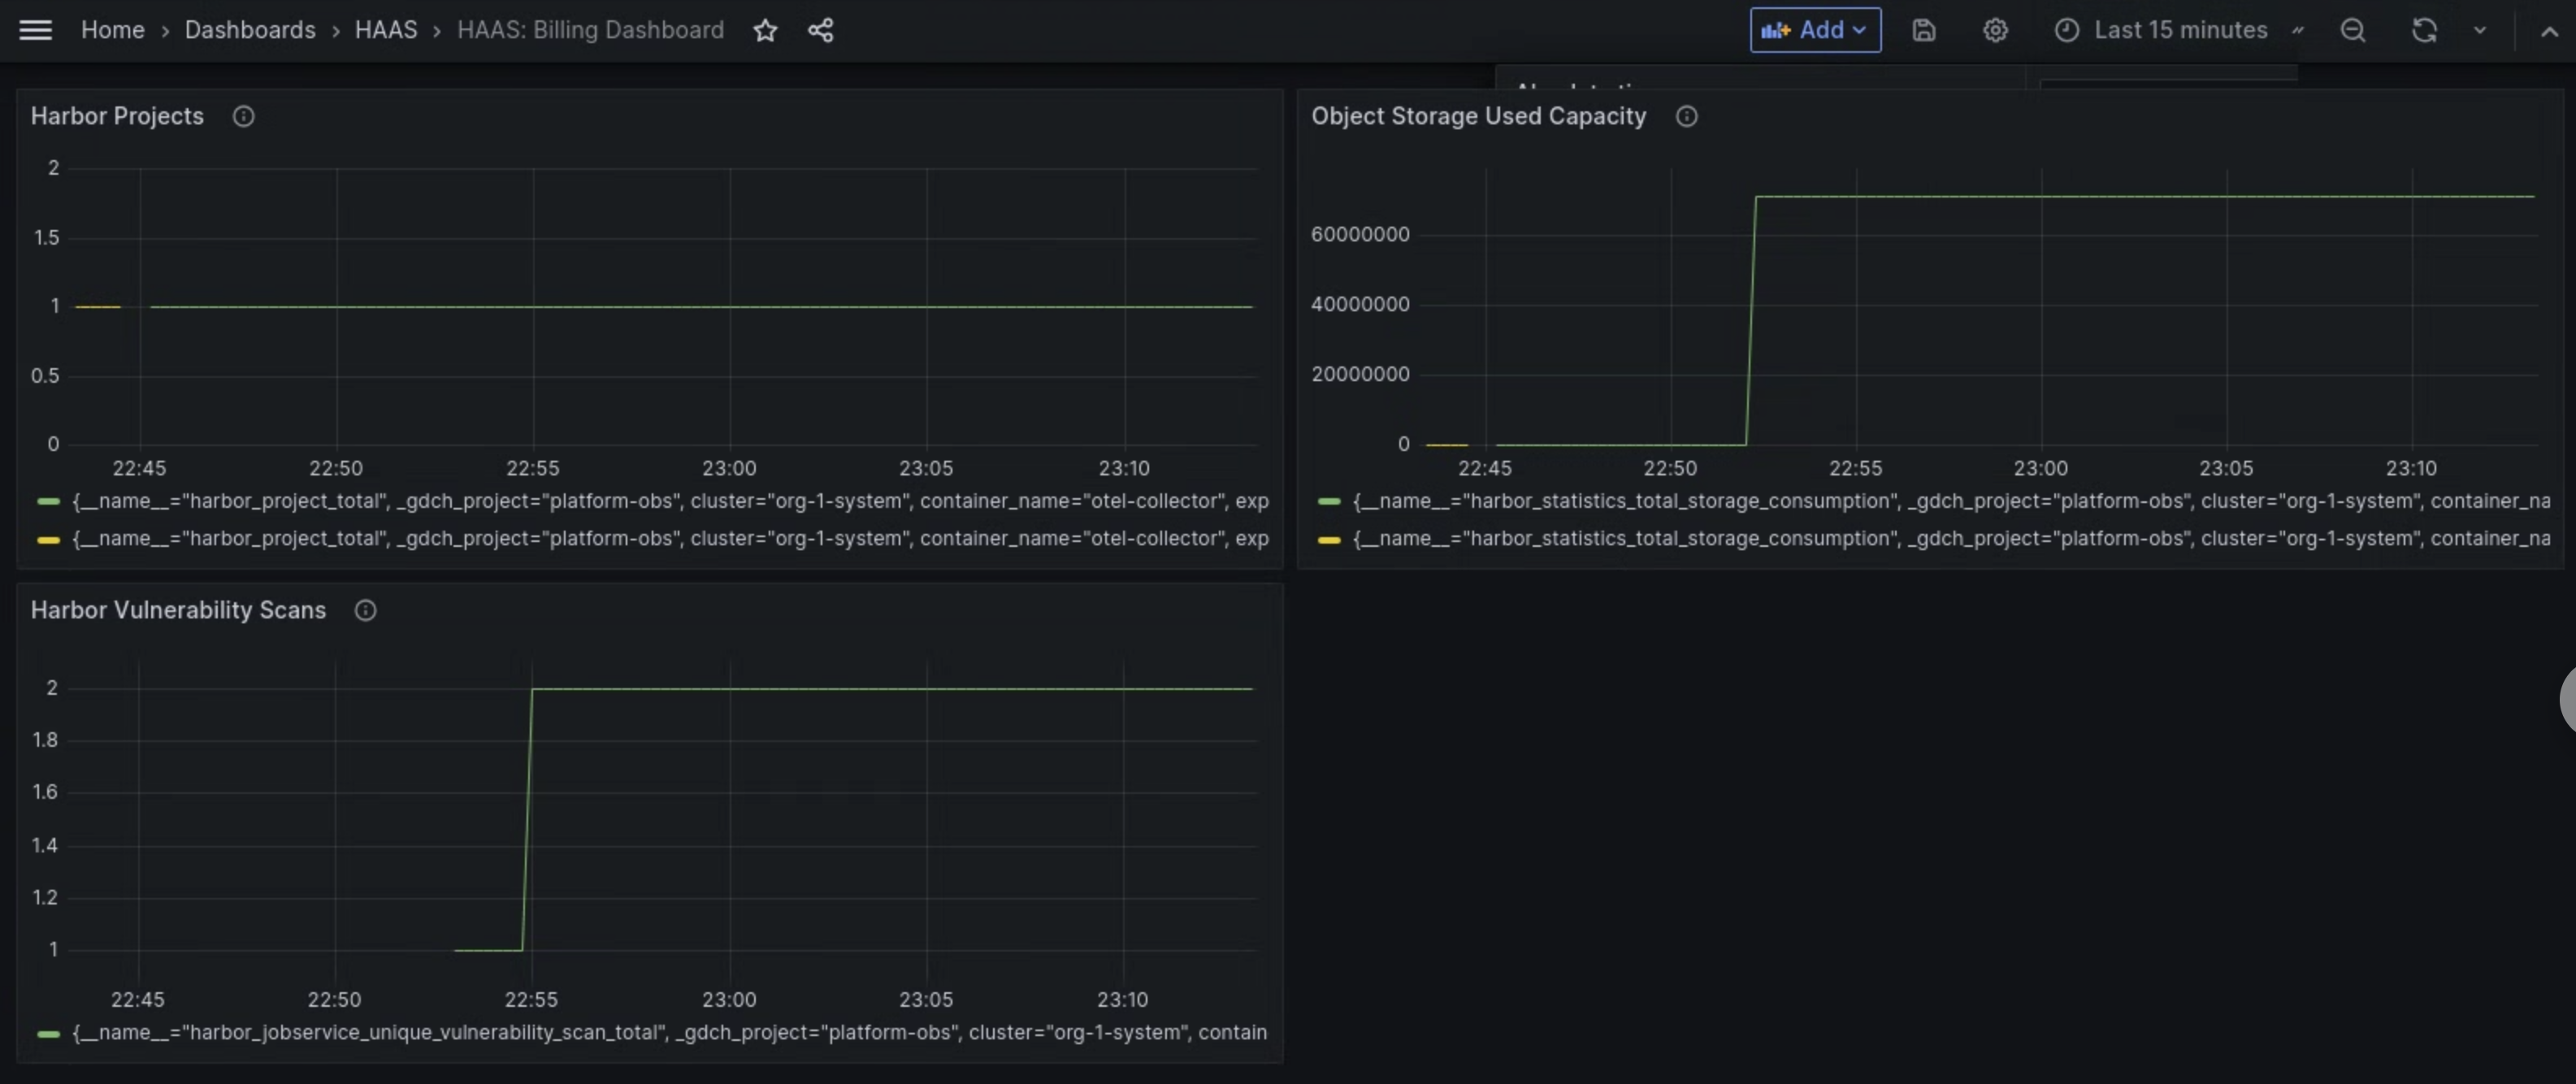
Figure 1. Use the MHS dashboard in Grafana to view metrics for Harbor vulnerability scans, storage consumption, and project counts.