Vertex Explainable AI는 이미지 데이터를 위한 시각화 기능을 기본적으로 제공합니다. 커스텀 학습 이미지 모델의 시각화를 구성할 수 있습니다.
이미지 분류 모델에 대한 설명을 요청하면 예측에 기여한 픽셀 또는 리전을 나타내는 이미지 오버레이와 함께 예측 클래스가 생성됩니다.
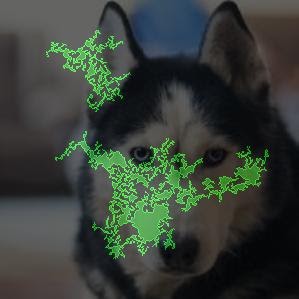
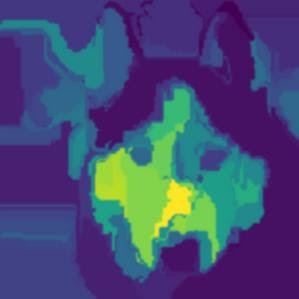
다음 이미지는 허스키 이미지의 시각화를 보여줍니다. 왼쪽 시각화는 통합 그래디언트 메서드를 사용하고 포지티브 기여 분석 영역을 강조표시합니다. 오른쪽 시각화는 포지티브 예측을 할 때 더 적은 영역(파란색) 및 더 큰 영역(노란색)을 나타내는 색상 그라디언트와 함께 XRAI 메서드를 사용합니다.
작업 중인 데이터 유형은 통합 그래디언트 또는 XRAI 접근방식을 사용하여 설명을 시각화하는 데 영향을 줄 수 있습니다.
- XRAI는 기본 이미지에 더 효과적이며 포지티브 기여 분석이 개 얼굴 모양과 관련이 있음을 보여주는 등 높은 수준의 통계 요약을 제공합니다.
- 통합 그래디언트(IG)는 픽셀 수준에서 세부정보를 제공하는 경향이 있으며 보다 세부적인 기여 분석에 유용합니다.
Vertex Explainable AI 개요 페이지에서 기여 분석 메서드에 대해 자세히 알아보세요.
시작하기
Vertex Explainable AI를 지원하는 Model 리소스를 생성하거나 Model의 ExplanationSpec을 재정의하는 경우 시각화를 구성합니다.
모델의 시각화를 구성하려면 시각화할 특성에 해당하는 InputMetadata 메시지의 visualization 필드를 채웁니다. 이 구성 메시지에서는 사용된 오버레이 유형, 강조표시되는 기여 분석, 색상 등의 옵션을 포함할 수 있습니다. 모든 설정은 선택사항입니다.
시각화 옵션
기본 설정과 권장 설정은 기여 분석 메서드(통합 그래디언트 또는 XRAI)에 따라 다릅니다. 다음 목록은 구성 옵션 및 사용 방법을 설명합니다. 전체 옵션 목록은 Visualization 메시지에 대한 API 참조를 확인하세요.
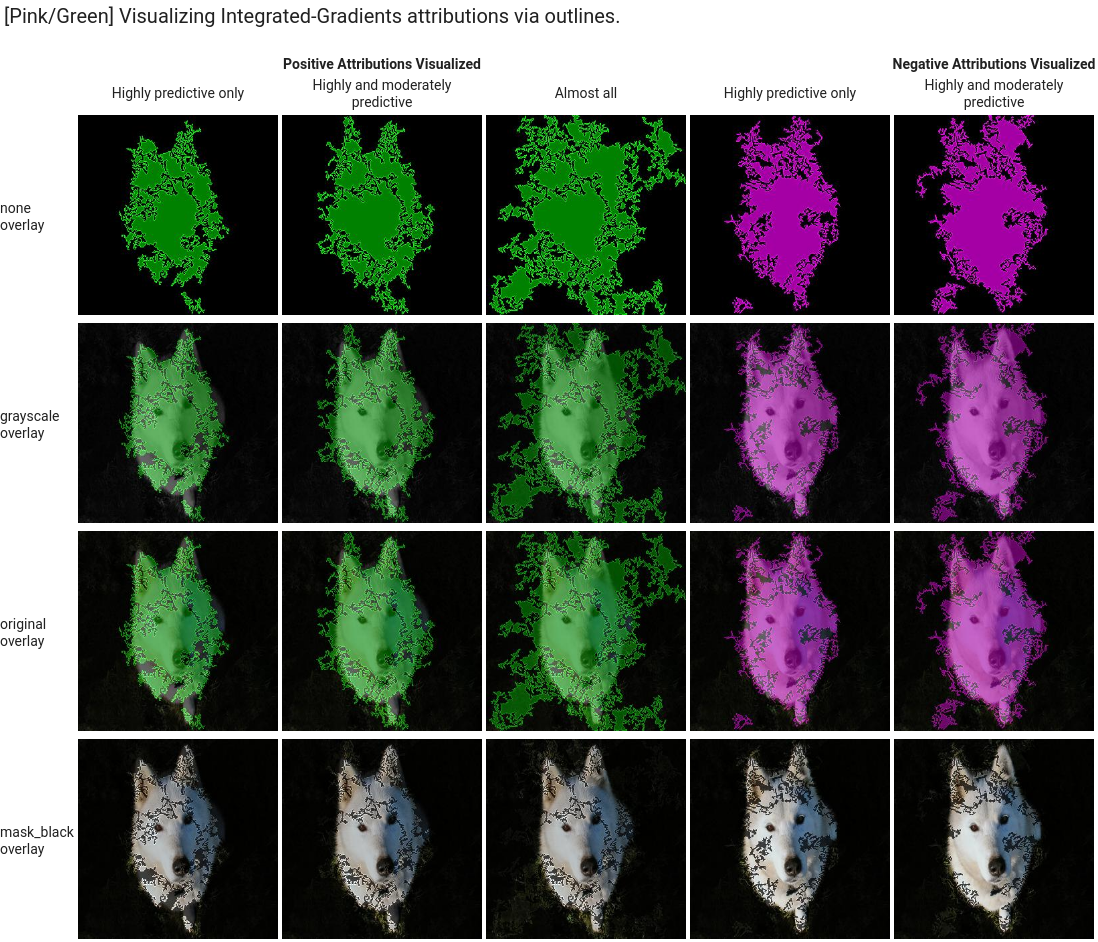
type: 사용된 시각화 유형(OUTLINES또는PIXELS)입니다.type필드는 기본적으로OUTLINES로 설정되며 이는 기여 분석의 리전을 나타냅니다. 픽셀당 기여 분석을 표시하려면 필드를PIXELS로 설정합니다.polarity: 강조표시된 기여 분석의 방향입니다. 기본적으로positive가 설정되어 포지티브 기여 분석이 가장 높은 영역을 강조표시합니다. 즉, 모델의 포지티브 예측에 가장 영향력 있는 픽셀을 강조표시합니다. Polarity를negative로 설정하면 모델이 포지티브 클래스를 예측하지 않도록 하는 영역을 강조표시합니다. 네거티브 polarity를 사용하면 잘못된 거짓음성 리전을 식별하여 모델을 디버깅하는 데 유용합니다. 또한 포지티브 및 네거티브 기여 분석을 모두 나타내는both로 polarity을 설정할 수도 있습니다.clip_percent_upperbound: 강조표시된 영역에서 지정된 백분위수 위의 기여 분석을 제외합니다. 클립 매개변수를 함께 사용하면 노이즈를 필터링하고 강력한 기여 분석 영역을 더 쉽게 볼 수 있습니다.clip_percent_lowerbound: 강조표시된 영역에서 지정된 백분위수 아래의 기여 분석을 제외합니다.color_map: 강조표시된 영역에 사용된 색 구성표입니다. 통합 그래디언트의 경우 기본값은pink_green으로, 포지티브 기여 분석은 녹색으로 표시되고 네거티브 기여 분석은 핑크색으로 표시됩니다. XRAI 시각화의 경우 색상 척도는 그라디언트입니다. XRAI 기본값은viridis으로, 가장 영향력이 큰 리전은 노란색으로, 가장 영향력이 적은 리전은 파란색으로 강조표시됩니다.가능한 값의 전체 목록은
Visualization메시지에 대한 API 참조를 확인하세요.overlay_type: 시각화에 원본 이미지가 표시되는 방식입니다. 원본 이미지로 시각화를 보기가 어려울 경우 오버레이를 조정하면 시각적 선명도를 높일 수 있습니다.가능한 값의 전체 목록은
Visualization메시지에 대한 API 참조를 확인하세요.
구성 예시
다음은 시작점으로 사용할 수 있는 샘플 Visualization 구성과 적용된 설정 범위를 보여주는 이미지입니다.
적분 경사
통합 그래디언트의 경우 기여 분석 영역에 노이즈가 너무 많은 경우 클립 값을 조정해야 할 수 있습니다.
visualization: {
  "type": "OUTLINES",
  "polarity": "positive",
  "clip_percent_lowerbound": 70,
  "clip_percent_upperbound": 99.9,
  "color_map": "pink_green",
  "overlay_type": "grayscale"
}
다음 시각화에는 outlines 및 pixels 유형이 모두 사용됩니다. "Highly predictive only", "Moderately predictive", "Almost all"로 라벨이 지정된 열은 다른 수준의 클리핑 예시로 시각화에 집중하는 데 도움이 될 수 있습니다.
![]()
XRAI
XRAI 시각화의 경우 오버레이가 기여 분석이 높은 영역과 낮은 영역을 표시하기 위해 경사를 사용하므로 XRAI의 클립 값 없이 시작하는 것이 좋습니다.
visualization: {
  "type": "PIXELS",
  "polarity": "positive",
  "clip_percent_lowerbound": 0,
  "clip_percent_upperbound": 100,
  "color_map": "viridis",
  "overlay_type": "grayscale"
}
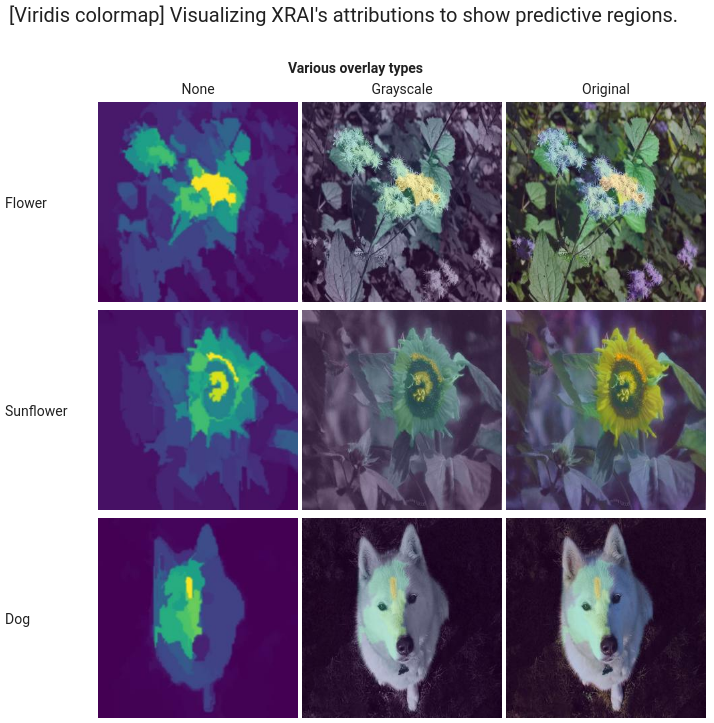
다음 이미지는 기본 viridis 색상 척도와 한 범위의 오버레이 유형을 사용하는 XRAI 시각화입니다. 노란색 영역은 예측에 긍정적으로 기여한 가장 영향력 있는 리전을 나타냅니다.
다음 단계
- 다른 Vertex Explainable AI 구성 옵션에 대한 자세한 내용은 커스텀 학습 모델에 대한 설명 구성을 참조하세요.