After collecting metrics from
your deployed workloads in Google Distributed Cloud (GDC) air-gapped, you can start
analyzing them. To analyze metrics, you can visualize and filter them on
informative Grafana dashboards or access them directly from Cortex using the
curl tool for flexible scripting and automation.
This page provides detailed instructions on how to query and visualize your
metrics using both the Grafana user interface and the curl tool for the Cortex
endpoint to gain insights into your workload performance.
You can access your metrics in one of the following two methods:
- Grafana dashboards: Explore trends and identify anomalies with intuitive visualizations of key metrics like CPU utilization, storage consumption, and network activity. Grafana provides a user-friendly interface for filtering and analyzing your workload data in dashboards.
- Cortex endpoint: For more advanced use cases, query your project's Cortex
instance directly using the
curltool on a command line. Cortex stores your project's Prometheus metrics and provides an HTTP endpoint for programmatic access. This access lets you export data, automate tasks, and build custom integrations.
Before you begin
To get the permissions that you need to query and visualize metrics on Grafana dashboards, ask your Organization IAM Admin or Project IAM Admin to grant you one of the predefined Organization Grafana Viewer or Project Grafana Viewer roles. Depending on the level of access and permissions you need, you might obtain Grafana roles in an organization or a project.
Alternatively, to get the permissions that you need to query metrics from the Cortex endpoint, ask your Project IAM Admin to grant you the Project Cortex Prometheus Viewer role in your project namespace.
For more information about these roles, see Prepare IAM permissions.
Obtain and filter your metrics
Select one of the following methods to build queries, visualize trends, and filter metrics from your project workloads:
Grafana dashboards
This section describes how to access your metrics using Grafana dashboards.
Identify your Grafana endpoint
The following URL is the endpoint of the Grafana instance of your project:
https://GDC_URL/PROJECT_NAMESPACE/grafana
Replace the following:
GDC_URL: the URL of your organization in GDC.PROJECT_NAMESPACE: your project namespace.For example, the Grafana endpoint for the
platform-obsproject in theorg-1organization ishttps://org-1/platform-obs/grafana.
View metrics in the Grafana user interface
Retrieve metrics in the Grafana user interface:
- In the GDC console, select your project.
- In the navigation menu, select Operations > Monitoring.
Click View all in Grafana.
A new page opens your Grafana endpoint and displays the user interface.
On the user interface, click explore Explore from the navigation menu to open the Explore page.
From the menu at the Explore bar, select a data source to retrieve metrics, according to your universe type:
Single-zone universes: Select prometheus to display metrics from the single zone of your universe.
Multi-zone universes: Grafana can connect to different zones and show cross-zone data. Select Metrics ZONE_NAME to display metrics from any zone of your universe, regardless of the zone you are signed in.
Additionally, to have cross-zone data visualizations in a single dashboard and add multiple zones to your query, select Mixed as the data source.
Enter a query to search for metrics using PromQL (Prometheus Query Language) expressions. You can do this step in either of the following ways:
- Select a metric and a label for your query from the Metric and Label filters menus. Click add Add to add more labels to your query. Then, click Run query.
- Enter your query directly in the Metrics text field and press Shift+Enter to run the query.
The page displays the metrics matching your query.
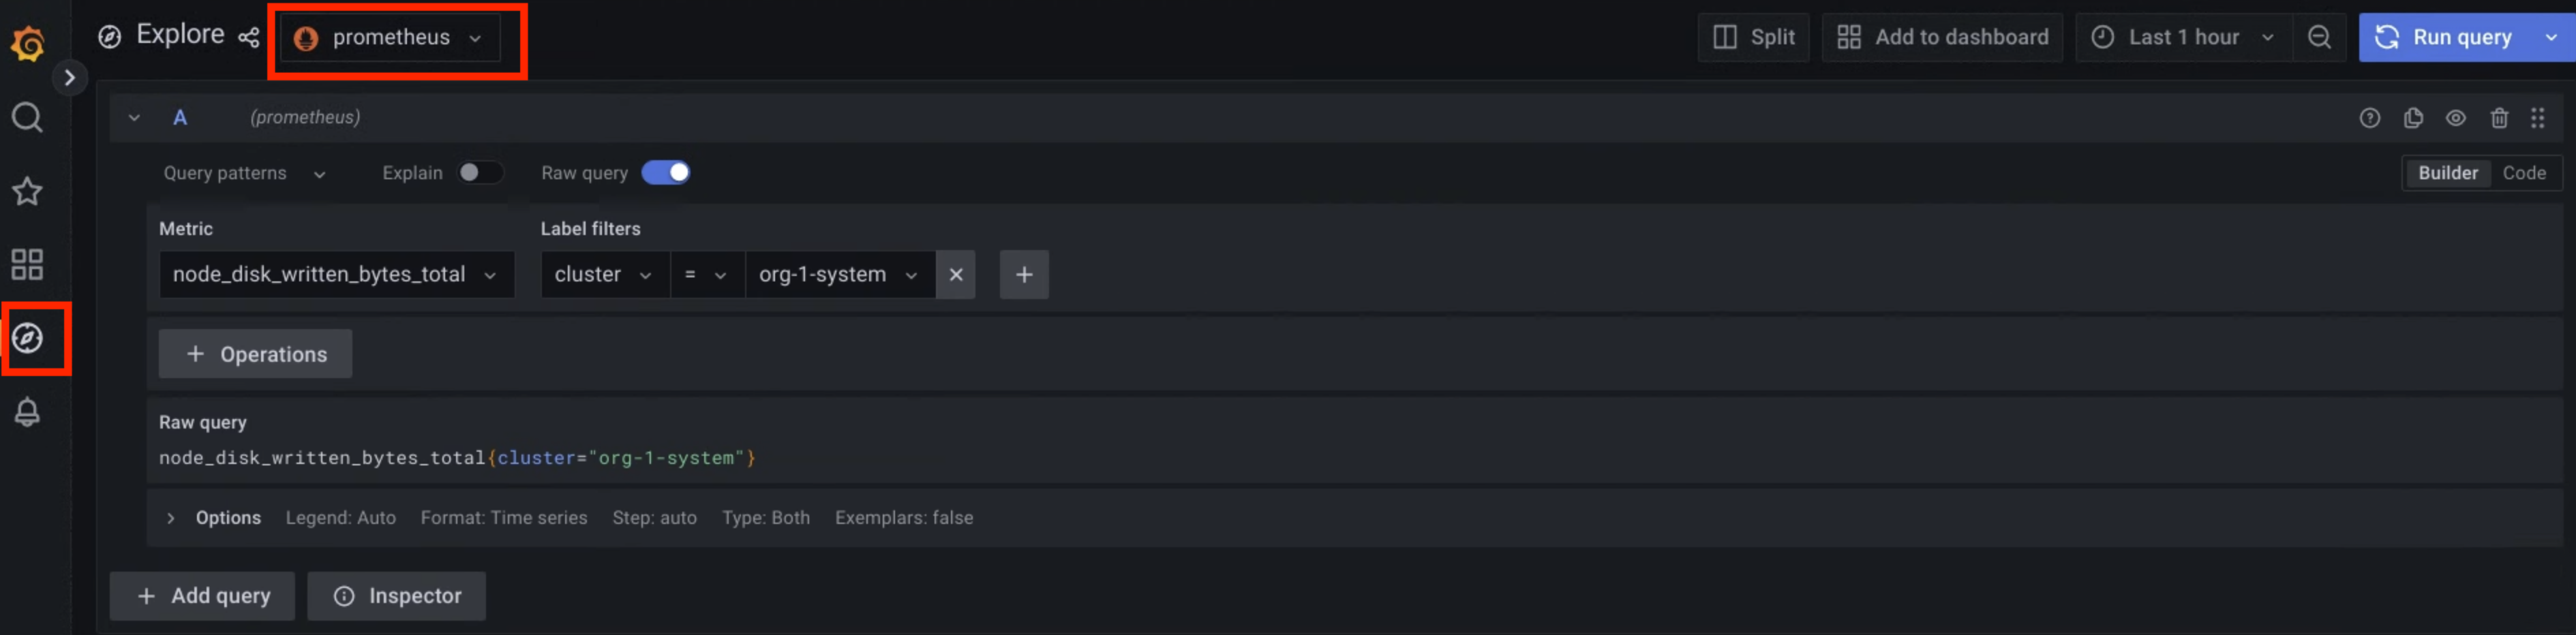
Figure 1. Menu option to query metrics from the Grafana user interface.
In figure 1, the prometheus option displays the interface that lets you build queries from Grafana to retrieve metrics.
For value examples of labels that you can use to query metrics, see Sample queries and labels.
Cortex endpoint
This section describes how to access your metrics using Cortex.
Identify your Cortex endpoint
The following URL is the endpoint of the Cortex instance of your project:
https://GDC_URL/PROJECT_NAMESPACE/cortex/prometheus/
Replace the following:
GDC_URL: the URL of your organization in GDC.PROJECT_NAMESPACE: your project namespace.For example, the Cortex endpoint for the
platform-obsproject in theorg-1organization ishttps://org-1/platform-obs/cortex/prometheus/.
Authenticate the curl request
- Download and install the gdcloud CLI.
Set the gdcloud
core/organization_console_urlproperty:gdcloud config set core/organization_console_url https://GDC_URLSign in with the configured identity provider:
gdcloud auth loginUse your username and password to authenticate and sign in.
When the login is successful, you can use the authorization header in your cURL request through the
gdcloud auth print-identity-tokencommand. For more information, see gdcloud auth.
Call the Cortex endpoint
Complete the following steps to reach the Cortex endpoint using the curl
tool:
- Authenticate the
curlrequest. Use
curlto call the Cortex endpoint and extend the URL using the standard Prometheus HTTP API (https://prometheus.io/docs/prometheus/latest/querying/api/) to query metrics.The following is an example of a
curlrequest:curl https://GDC_URL/PROJECT_NAME/cortex/prometheus/api/v1/query?query=my_metric{cluster="my-cluster"}&time=2015-07-01T20:10:51.781Z \ -H "Authorization: Bearer $(gdcloud auth print-identity-token \ --audiences=https://GDC_URL)"You obtain the output following the command. The API response is in JSON format.
Sample queries and labels
You can query metrics using the metric name and key-value pairs for labels. A PromQL query has the following syntax:
metric_name{label_one="value", label_two="value"}
Labels let you differentiate the characteristics of a metric. In this way, container authors make their workloads generate metrics and add tags to filter those metrics.
For example, you can have an api_http_requests_total metric to count the
number of HTTP requests received. Then, you can add a request_method label on
this metric, which takes a POST, GET, or PUT value. Consequently, you
create three metric streams for each request type you might receive. In this
case, to find the number of HTTP GET requests, you run the following query:
api_http_requests_total{request_method="GET"}
See https://prometheus.io/docs/practices/naming/ for more information about metrics and labels.
The following are some of the default labels that the MonitoringTarget custom
resource adds. You can use these default labels to query metrics:
_gdch_service: the short name of the service.cluster: the name of the cluster.container_name: the name of the container within a pod.namespace_name: your project namespace.pod_name: the pod name prefix.
The following table describes the labels that Prometheus adds automatically:
| Metric label | Description |
|---|---|
job |
The internal name of the scrape job used to collect the metric. Jobs
created by the MonitoringTarget custom resource have a name
with the following pattern:obs-system/OBS_SHADOW_PROJECT_NAME/MONITORINGTARGET_NAME.MONITORINGTARGET_NAMESPACE/I/JI and J are unique numbers determined internally
to avoid name conflicts. |
instance |
The $IP:$PORT of the scrapped service. If a workload
resource has multiple replicas, use this field to differentiate them. |
The following code samples show the use of key-value pairs for labels to query different metrics:
View all the metric streams of the processed operations in your project:
processed_ops_totalView the processed operations collected in a Kubernetes cluster:
processed_ops_total{cluster="CLUSTER_NAME"}View the CPU usage collected in a Kubernetes cluster:
cpu_usage{cluster="CLUSTER_NAME"}
Use the metrics relabeling tool to add labels not exposed initially by the
scrapped containers and rename produced metrics. You must configure the
MonitoringTarget custom resource to add labels on the metrics it collects.
Specify those labels in the metricsRelabelings field of the custom resource.
For more information, see
Label metrics.