Mit Sammlungen den Überblick behalten
Sie können Inhalte basierend auf Ihren Einstellungen speichern und kategorisieren.
In den Dashboards für Abrechnungsberichte können Sie die Nutzung der einzelnen Ressourcen einsehen.
Mit diesen Dashboards können Sie Ihren Ressourcenverbrauch über einen bestimmten Zeitraum hinweg nachvollziehen und Ihre Ressourcen effektiv verwalten.
Bitten Sie Ihren IAM-Administrator der Organisation, Ihnen die entsprechende Betrachterrolle für Ihr Projekt zuzuweisen, damit Sie die Berechtigungen erhalten, die Sie zum Aufrufen der Abrechnungsnutzungs-Dashboards benötigen.
Die Dashboards zur Abrechnungsnutzung bestehen aus folgenden Elementen:
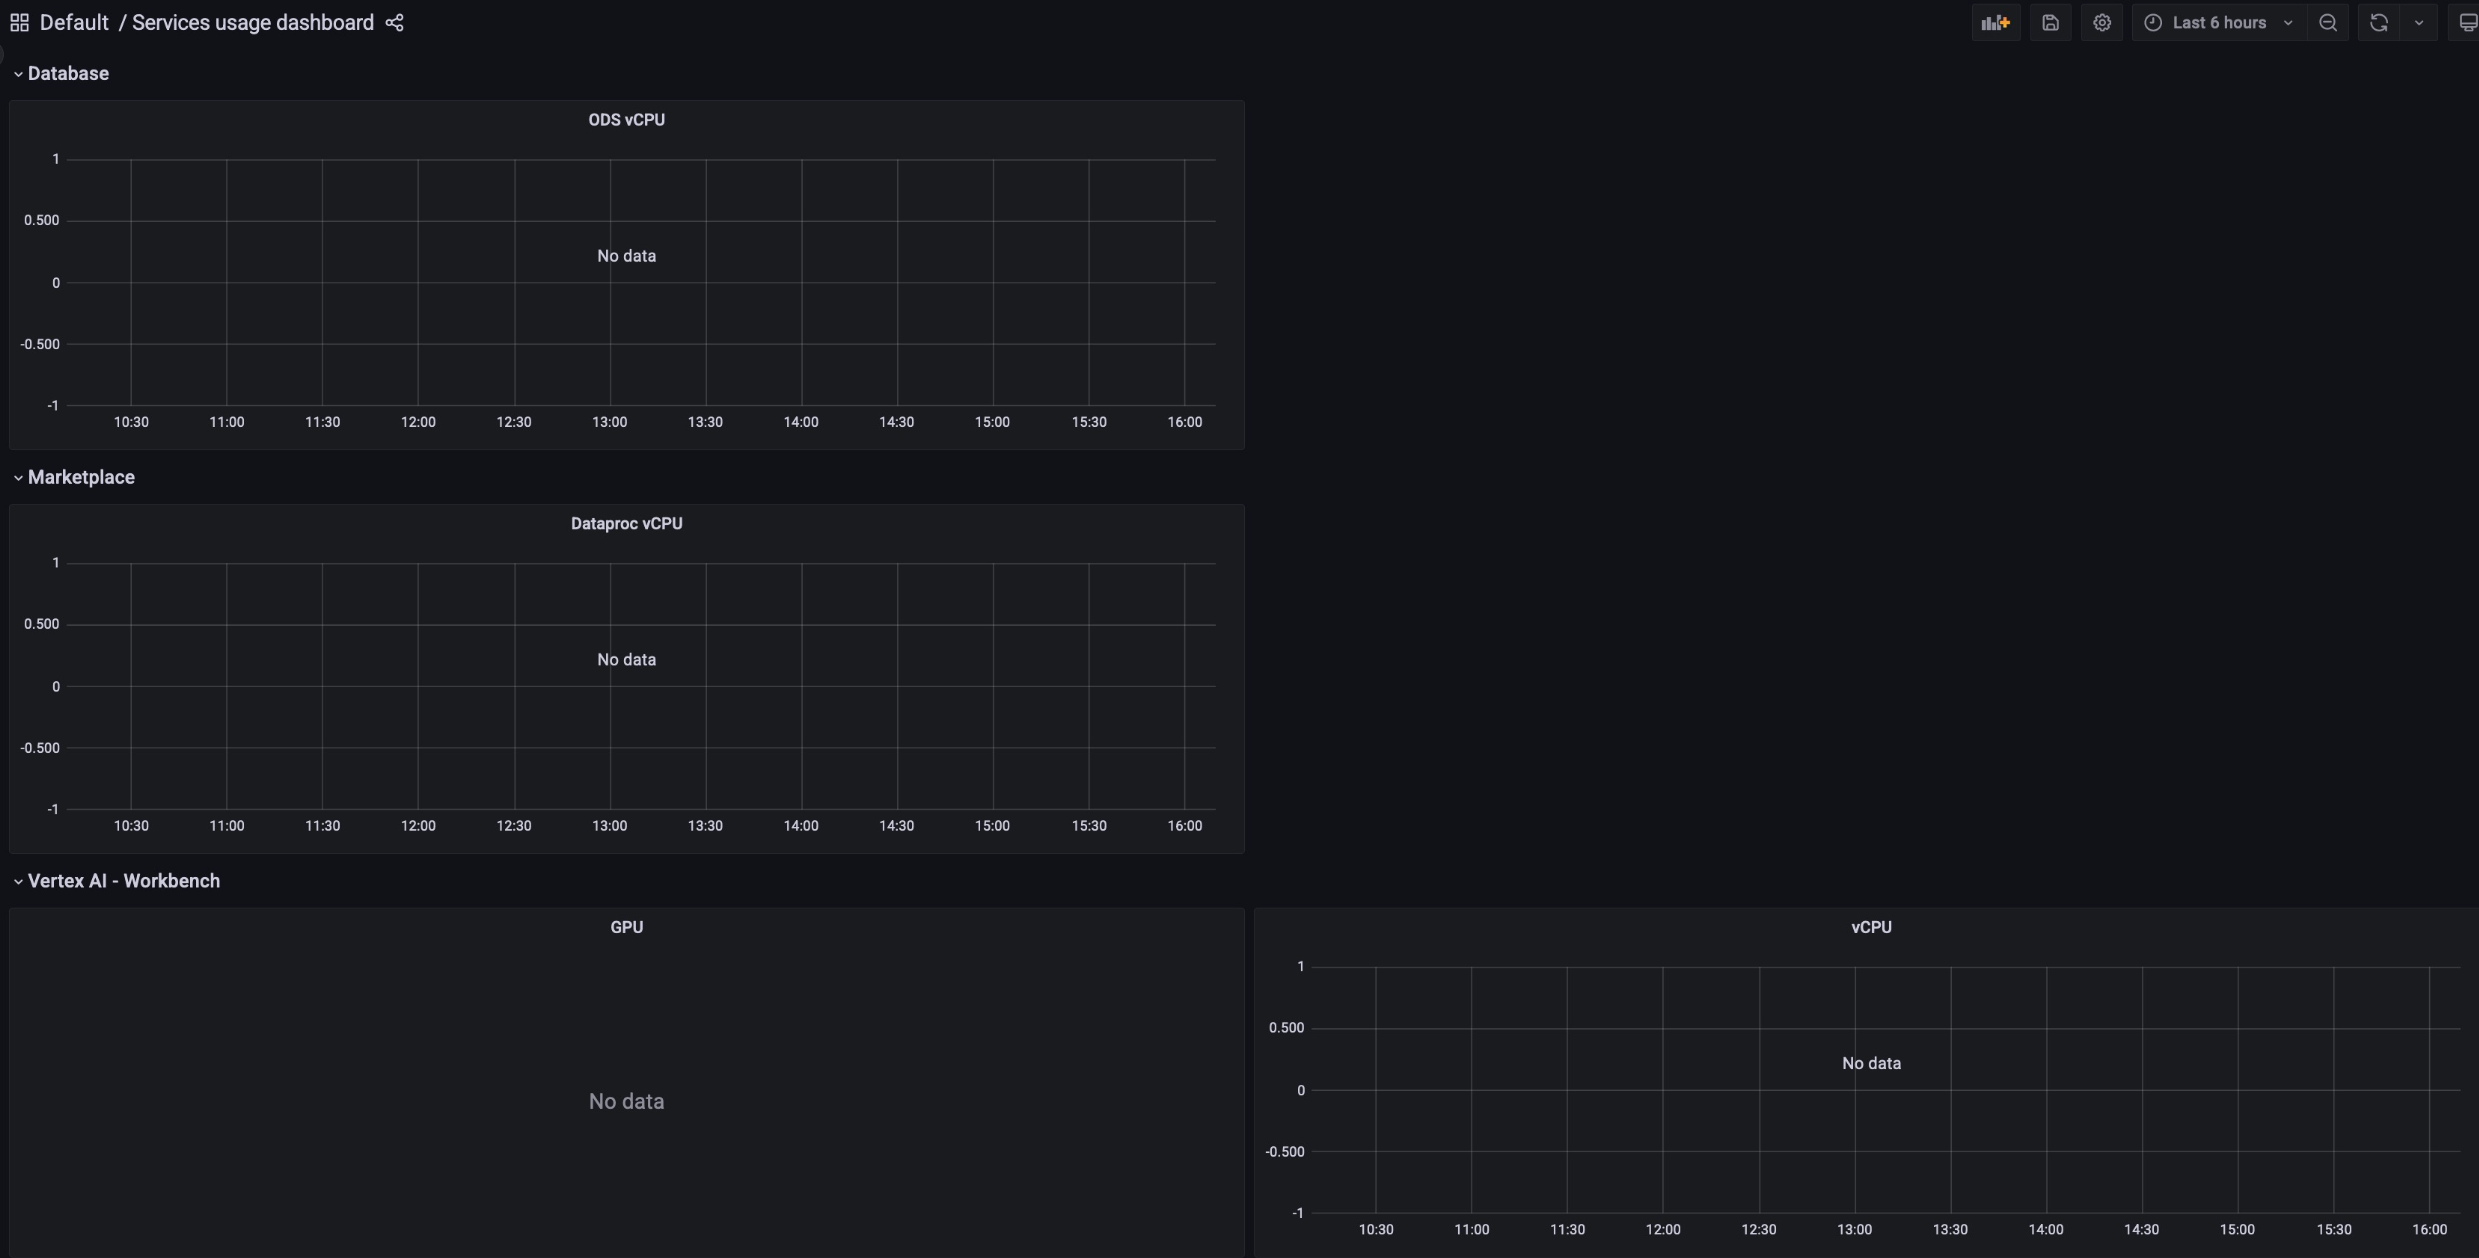
Speicherzuweisung: Hier wird erfasst, wie viel Ressourcennutzung ein bestimmter Dienst in Ihrem Projekt verursacht hat. Dienste umfassen Ressourcen wie Backup, Marketplace, Database Service und Vertex AI.
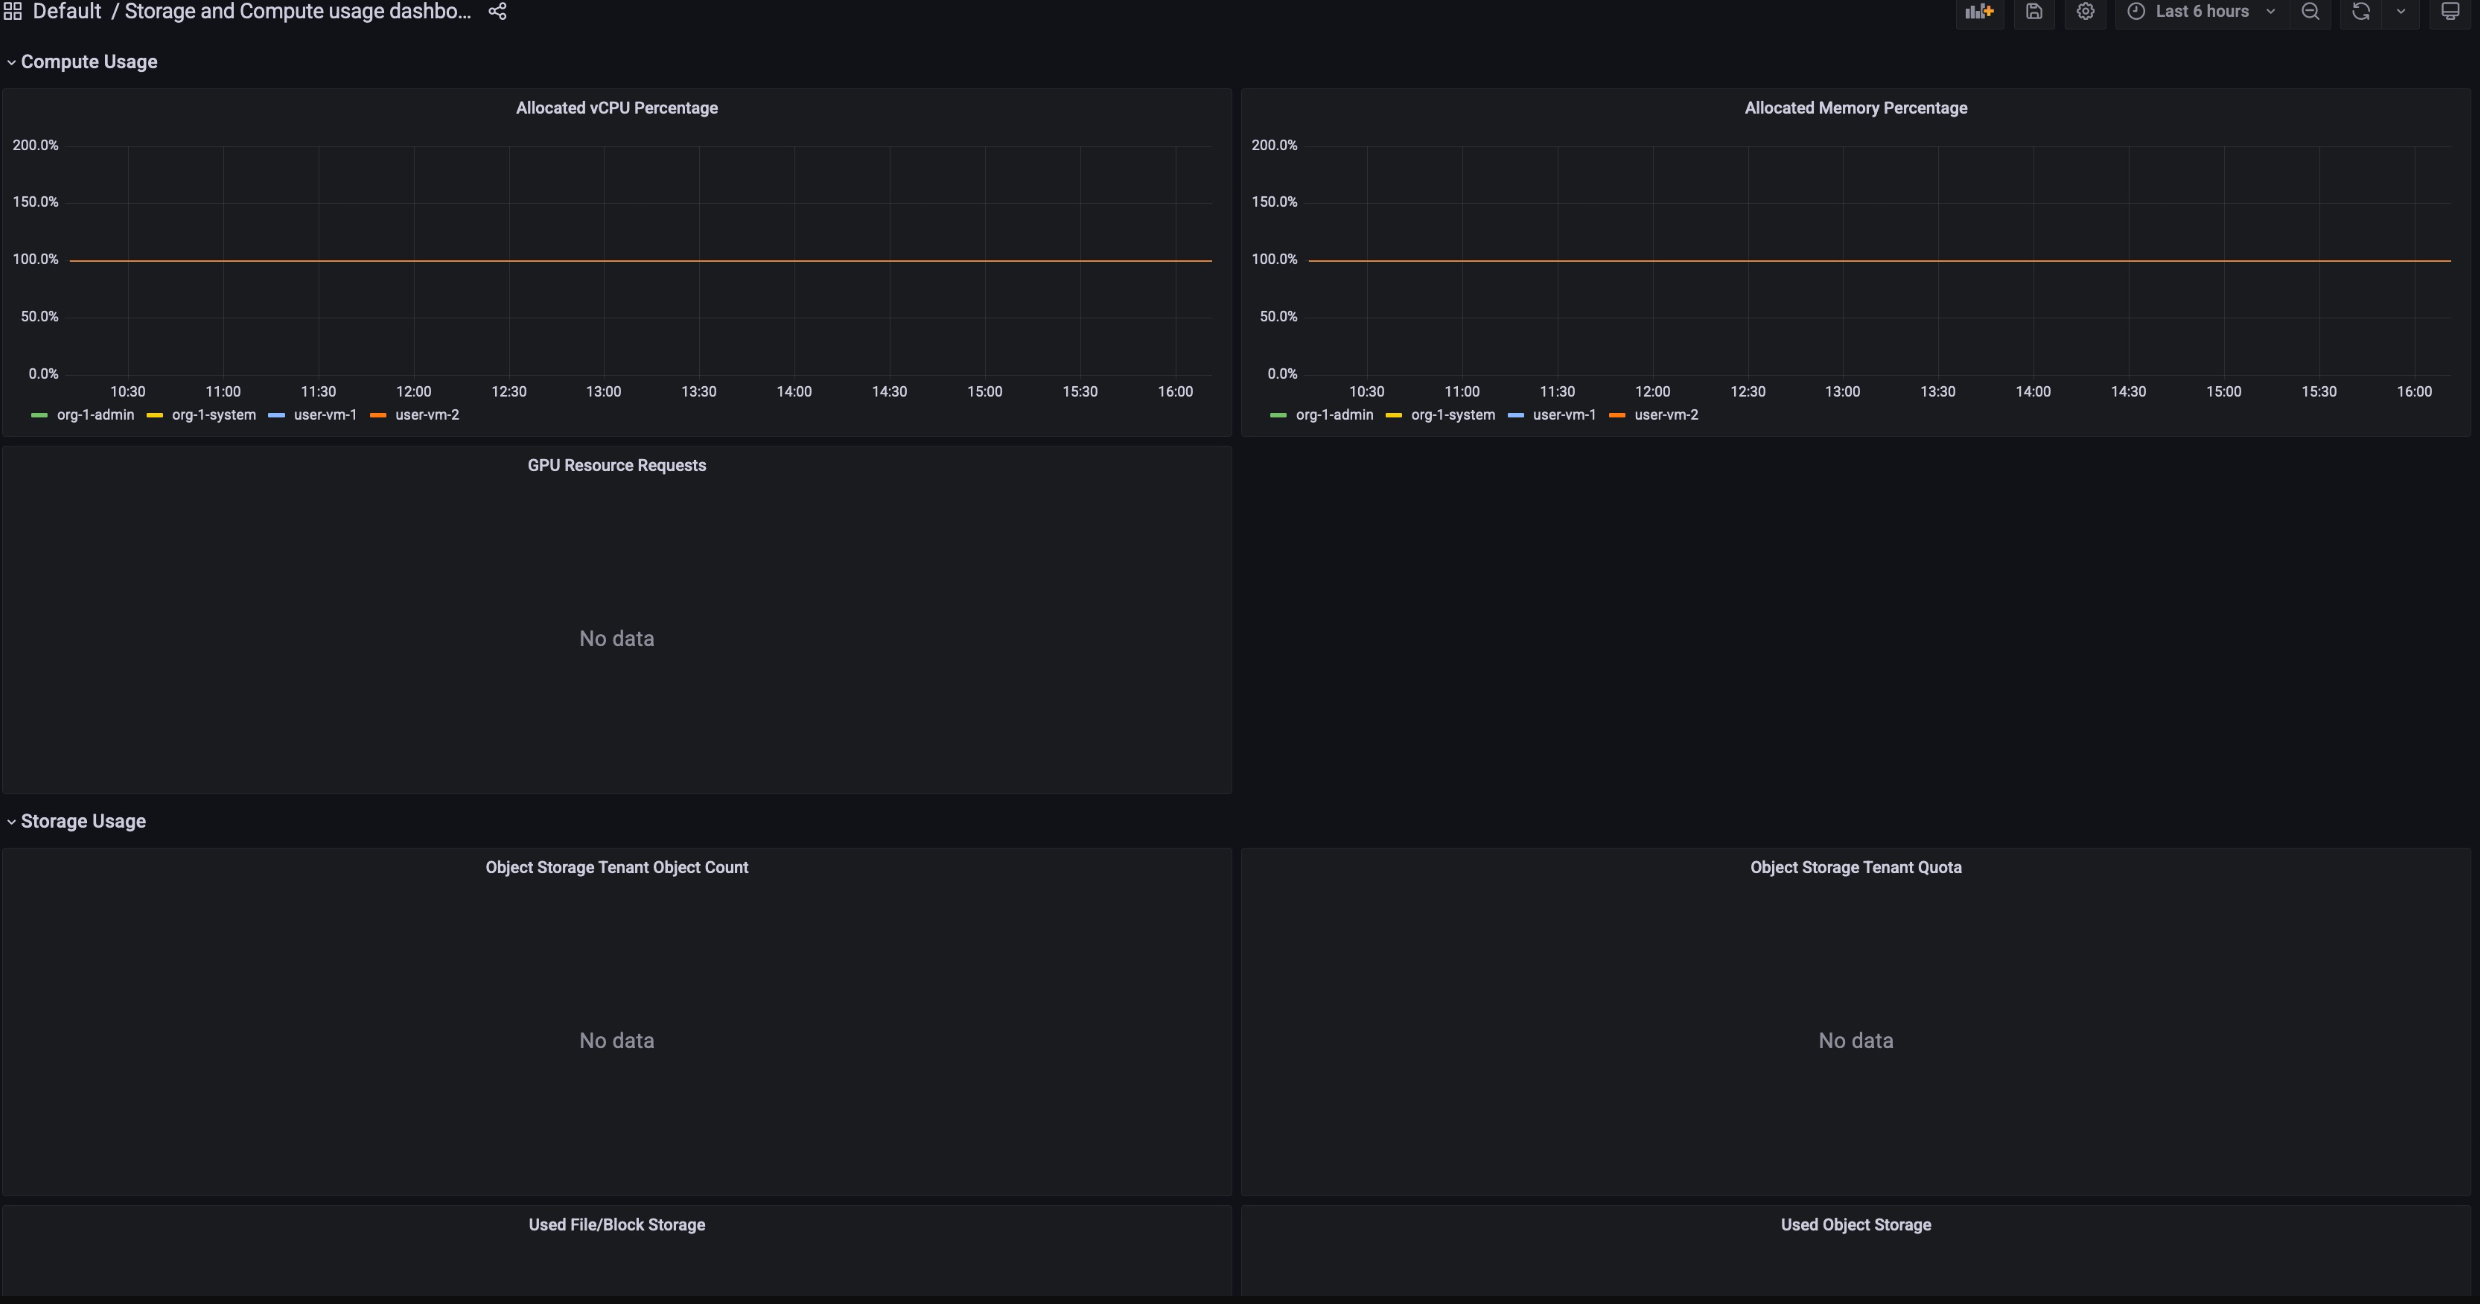
Compute Allocation (Zuweisung von Rechenressourcen): Hier werden die Messwerte zur Ressourcennutzung für Speicher- und Compute-Dienste für einen bestimmten Zeitraum erfasst. Dieses Dashboard ist für Monitoring-Zwecke verfügbar.
So rufen Sie die Dashboards zur Abrechnungsnutzung auf:
Melden Sie sich in der GDC-Konsole an.
Wählen Sie im Navigationsmenü Abrechnung > Berichte aus.
Wählen Sie auf der Seite Abrechnungsberichte den Dienst aus, den Sie aufrufen möchten.
Wenn Sie beispielsweise den Messwertverbrauch des verwalteten Dienstes Vertex AI aufrufen möchten, klicken Sie entweder auf GPU oder vCPU.
Wenn Sie einen bestimmten Zeitraum in einem Dashboard aufrufen möchten, klicken Sie in der Menüleiste auf das Drop-down-Menü Zeit. Im Drop-down-Menü Zeit werden standardmäßig die Messwerte der letzten sechs Stunden angezeigt.
[[["Leicht verständlich","easyToUnderstand","thumb-up"],["Mein Problem wurde gelöst","solvedMyProblem","thumb-up"],["Sonstiges","otherUp","thumb-up"]],[["Schwer verständlich","hardToUnderstand","thumb-down"],["Informationen oder Beispielcode falsch","incorrectInformationOrSampleCode","thumb-down"],["Benötigte Informationen/Beispiele nicht gefunden","missingTheInformationSamplesINeed","thumb-down"],["Problem mit der Übersetzung","translationIssue","thumb-down"],["Sonstiges","otherDown","thumb-down"]],["Zuletzt aktualisiert: 2025-09-04 (UTC)."],[[["\u003cp\u003eBilling reports dashboards allow you to track resource consumption over time for effective resource management.\u003c/p\u003e\n"],["\u003cp\u003eDashboards are available for both Storage Allocation and Compute Allocation, showing resource usage metrics for various services.\u003c/p\u003e\n"],["\u003cp\u003eTo view the dashboards, you must be granted the corresponding viewer role by your Organization IAM Admin.\u003c/p\u003e\n"],["\u003cp\u003eYou can view resource usage for specific services, such as Vertex AI, within the Billing reports page by selecting the desired service.\u003c/p\u003e\n"],["\u003cp\u003eThe dashboards display resource consumption metrics, which may not directly correspond to the final pricing shown on invoices.\u003c/p\u003e\n"]]],[],null,["# Track resource consumption\n\nView the consumption of each resource through the Billing reports dashboards.\nThese dashboards are available to track your resource consumption over a period\nof time, and help you manage your resources effectively.\n\nTo get the permissions you need to view the Billing Usage dashboards, ask\nyour Organization IAM Admin to grant you the corresponding viewer role for your\nproject.\n\nThe Billing Usage dashboards consist of the following:\n\n- **Storage Allocation**: tracks how much resource usage a given service in your\n project has consumed. Services include resources such as Backup,\n Marketplace, Database Service, and Vertex AI.\n\n | **Important:** Metrics in the Services Usage dashboard is not a direct mapping to the price you might see in the Invoice dashboard. For example, the quantity of consumption you see in the Services Usage dashboard might not match the quantity GDC used to calculate the price in the Invoice dashboard.\n- **Compute Allocation**: tracks the metrics of resource usage on\n Storage and Compute services for a given period of time. This dashboard is\n available for monitoring purposes.\n\nTo view the Billing Usage dashboards, work through the following steps:\n\n1. Sign in to the GDC console.\n2. In the navigation menu, select **Billing \\\u003e Reports**.\n3. In the **Billing reports** page, select the service that you want to view. For example, to view the metric consumption of the managed service, Vertex AI, click either `GPU` or `vCPU`.\n4. To view a certain period of time in a given dashboard, click the **Time** drop-down in the menu bar. The **Time** drop-down defaults to show the metrics of the last six hours."]]