Ersetzen Sie GDC_URL durch die URL Ihrer Organisation in Google Distributed Cloud (GDC) Air-Gapped.
Dashboard für KUB-Nutzercluster
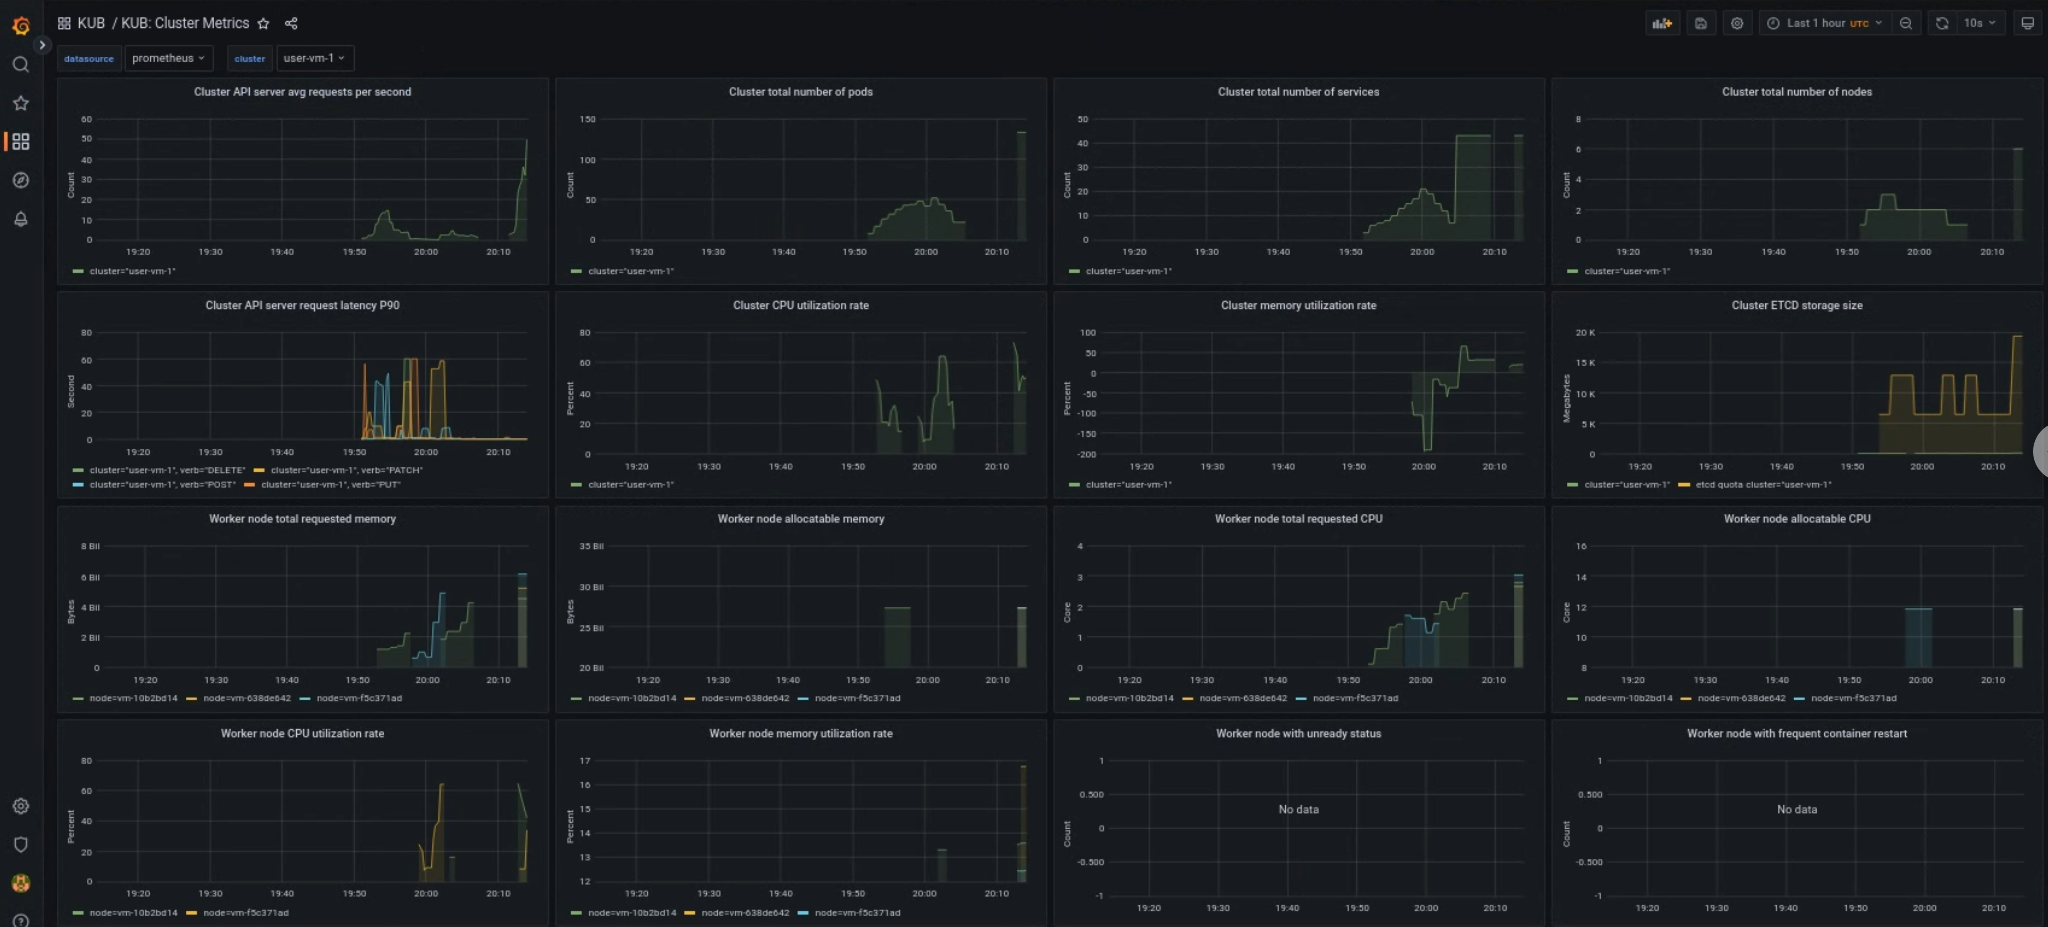
Das KUB-Dashboard enthält Diagramme und Visualisierungsbereiche mit Informationen zum Status von Nutzerclustern in Ihrem Projekt-Namespace.
Sie können den allgemeinen Zustand von Nutzerclustern ansehen, um Probleme zu beheben und potenzielle Ressourcenbeschränkungen auf Clusterebene zu ermitteln.
Allgemeiner Zustand des Nutzerclusters
In diesem Dashboard erhalten Sie wichtige Informationen zum Zustand Ihres Kubernetes-Clusters, z. B.:
[[["Leicht verständlich","easyToUnderstand","thumb-up"],["Mein Problem wurde gelöst","solvedMyProblem","thumb-up"],["Sonstiges","otherUp","thumb-up"]],[["Schwer verständlich","hardToUnderstand","thumb-down"],["Informationen oder Beispielcode falsch","incorrectInformationOrSampleCode","thumb-down"],["Benötigte Informationen/Beispiele nicht gefunden","missingTheInformationSamplesINeed","thumb-down"],["Problem mit der Übersetzung","translationIssue","thumb-down"],["Sonstiges","otherDown","thumb-down"]],["Zuletzt aktualisiert: 2025-09-04 (UTC)."],[[["\u003cp\u003eThe KUB component's metrics dashboard offers visual panels for monitoring user cluster health.\u003c/p\u003e\n"],["\u003cp\u003eAccess the user cluster health dashboard via the provided URL, replacing \u003ccode\u003e<var translate="no">GDC_URL</var>\u003c/code\u003e with your organization's URL.\u003c/p\u003e\n"],["\u003cp\u003eThe dashboard provides data regarding general user cluster health for troubleshooting and identifying potential resource constraints.\u003c/p\u003e\n"],["\u003cp\u003eInsights on API server traffic, latency, cluster CPU and memory usage, and node conditions are available on this user cluster dashboard.\u003c/p\u003e\n"]]],[],null,["# Monitor Kubernetes cluster health metrics\n\nThe metrics dashboard of the KUB component provides graphical information and\nvisualization panels for viewing user cluster health.\n\nOpen the following URL to access the user cluster health dashboard: \n\n https://\u003cvar translate=\"no\"\u003eGDC_URL\u003c/var\u003e/platform-obs/grafana/KUB-pa-cluster-metrics\n\nReplace \u003cvar translate=\"no\"\u003eGDC_URL\u003c/var\u003e with the URL of your organization in\nGoogle Distributed Cloud (GDC) air-gapped.\n\nKUB user cluster dashboard\n--------------------------\n\nThe KUB dashboard presents graphs and visualization panels that contain\ninformation about user cluster health in your project namespace.\n\nYou can view the general health of user clusters to troubleshoot issues and to\nidentify potential resource constraints at the cluster level.\n\n### User cluster general health\n\nIn this dashboard, you can gain valuable insights for your Kubernetes cluster\nhealth, such as the following:\n\n- API server traffic and latency\n- Cluster CPU and memory usage\n- Node conditions"]]