Mit Sammlungen den Überblick behalten
Sie können Inhalte basierend auf Ihren Einstellungen speichern und kategorisieren.
Das Messwert-Dashboard der MHS-Komponente (Managed Harbor Service) bietet Diagramme und Visualisierungsbereiche zum Anzeigen der Speichernutzung und der Anzahl der durchgeführten Scans auf Sicherheitslücken.
Öffnen Sie die folgende URL, um auf das Dashboard für den Zustand des Nutzerclusters zuzugreifen:
GDC_URL: Die URL Ihrer Organisation in Google Distributed Cloud (GDC) Air-Gapped.
ORG_ID: die ID für Ihre Organisation in GDC.
Dashboard mit Messwerten für psychische Gesundheit aufrufen
In diesem Dashboard erhalten Sie wertvolle Statistiken für Ihre Harbor-Instanzen, z. B.:
Die Anzahl der durchgeführten Harbor-Scans auf Sicherheitslücken.
Die Menge der verwendeten Objektspeicherkapazität.
Die Anzahl der Harbor-Projekte.
Im Bereich Harbor Vulnerability Scans (Harbor-Scans auf Sicherheitslücken) sehen Sie die Anzahl der Scans auf Sicherheitslücken, die Sie für Ihre Harbor-Instanzen ausführen.
Im Bereich Object Storage Used Capacity (Verwendete Kapazität für Objektspeicher) können Sie Messwerte zum Speicherverbrauch aufrufen und die Menge der von Ihnen verwendeten Objektspeicherressourcen messen.
Im Bereich Harbor-Projekte sehen Sie die Anzahl aller Harbor-Projekte in der Harbor-Instanz.
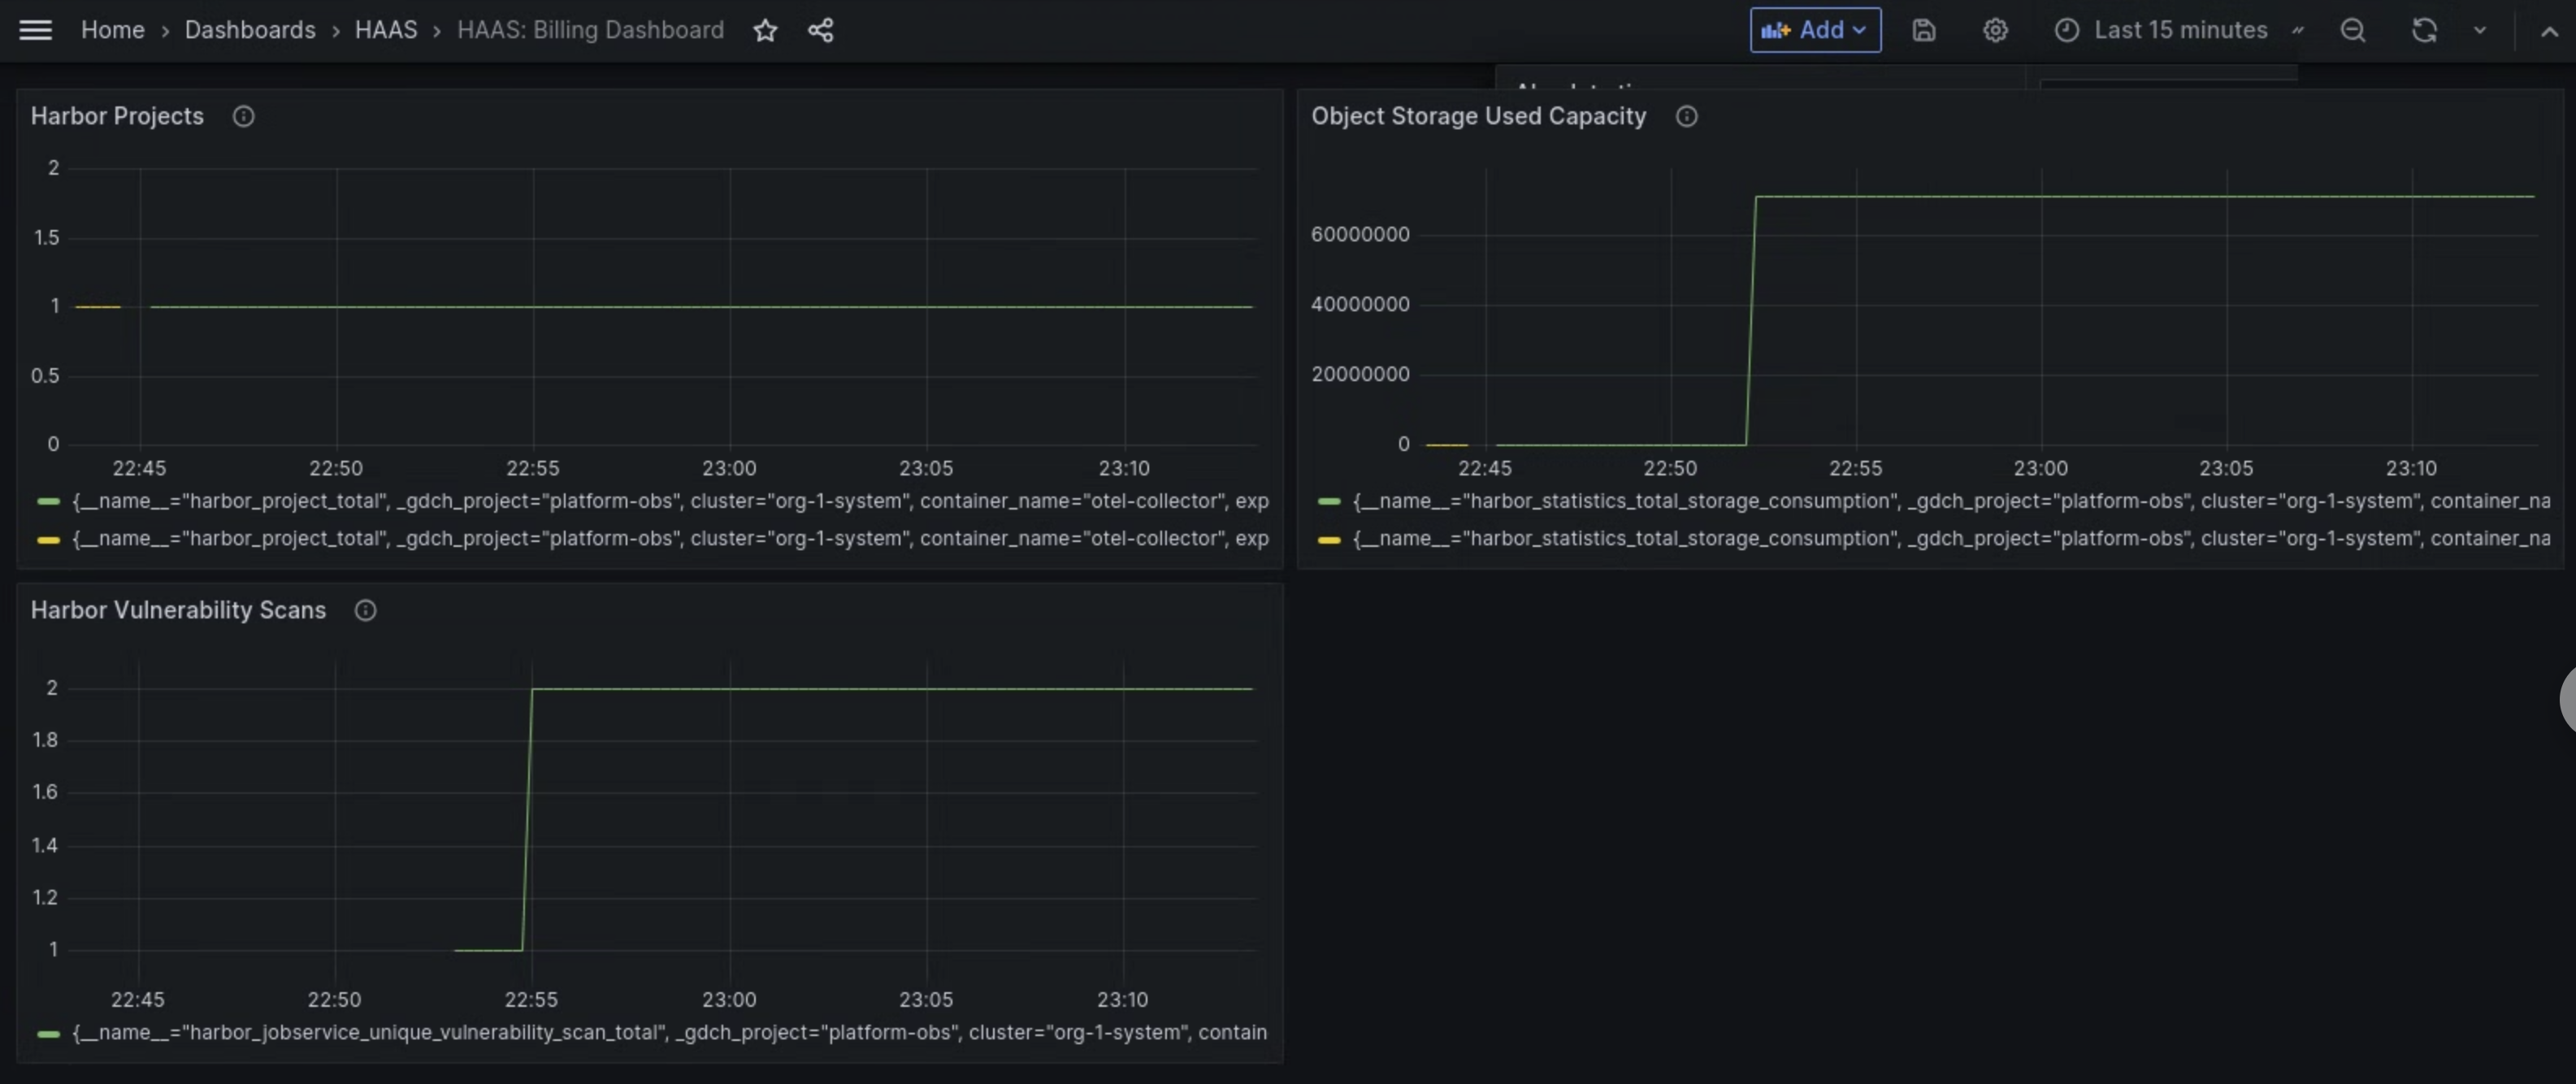
Abbildung 1. Im MHS-Dashboard in Grafana können Sie Messwerte für Harbor-Sicherheitslückenscans, Speichernutzung und Projektanzahl ansehen.
[[["Leicht verständlich","easyToUnderstand","thumb-up"],["Mein Problem wurde gelöst","solvedMyProblem","thumb-up"],["Sonstiges","otherUp","thumb-up"]],[["Schwer verständlich","hardToUnderstand","thumb-down"],["Informationen oder Beispielcode falsch","incorrectInformationOrSampleCode","thumb-down"],["Benötigte Informationen/Beispiele nicht gefunden","missingTheInformationSamplesINeed","thumb-down"],["Problem mit der Übersetzung","translationIssue","thumb-down"],["Sonstiges","otherDown","thumb-down"]],["Zuletzt aktualisiert: 2025-09-04 (UTC)."],[[["\u003cp\u003eThe Managed Harbor Service (MHS) metrics dashboard provides visualizations for storage consumption and vulnerability scan counts.\u003c/p\u003e\n"],["\u003cp\u003eYou can access the MHS dashboard via a specific URL, replacing placeholders for your organization's URL and ID.\u003c/p\u003e\n"],["\u003cp\u003eThe dashboard displays the number of Harbor vulnerability scans, the amount of object storage capacity used, and the number of Harbor projects.\u003c/p\u003e\n"],["\u003cp\u003ePanels are provided for harbor vulnerability scans, object storage used capacity and a view of total Harbor Projects.\u003c/p\u003e\n"]]],[],null,["# Monitor Harbor metrics\n\nThe metrics dashboard of the Managed Harbor Service (MHS) component provides graphs and visualization panels for\nviewing storage consumption and the number of vulnerability scans performed.\n\nOpen the following URL to access the user cluster health dashboard: \n\n https://\u003cvar translate=\"no\"\u003eGDC_URL\u003c/var\u003e/platform-obs/grafana/d/haas-billing/haas-billing-dashboard?orgId=\u003cvar translate=\"no\"\u003eORG_ID\u003c/var\u003e\n\nReplace the following:\n\n- \u003cvar translate=\"no\"\u003eGDC_URL\u003c/var\u003e: the URL of your organization in Google Distributed Cloud (GDC) air-gapped.\n- \u003cvar translate=\"no\"\u003eORG_ID\u003c/var\u003e: the ID for your organization in GDC.\n\nView the MHS metrics dashboard\n------------------------------\n\nIn this dashboard, you can gain valuable insights for your Harbor instances, such as the following:\n\n- The number of Harbor vulnerability scans performed.\n- The amount of object storage capacity used.\n- The number of Harbor projects.\n\nUse the **Harbor Vulnerability Scans** panel to view the number of vulnerability scans you are performing for your Harbor instances.\n\nUse the **Object Storage Used Capacity** panel to view storage consumption metrics and measure the amount of object storage resources you are using.\n\nUse the **Harbor Projects** panel to view the count of all Harbor projects in the Harbor instance.\n\n**Figure 1.** Use the MHS dashboard in Grafana to view metrics for Harbor vulnerability scans, storage consumption, and project counts."]]