“支出报告”信息中心是一种费用管理工具,可帮助您了解与您的账单对应的各项费用。该信息中心会显示指定日期范围内账单的费用明细视图,其中包含 SKU 说明。您还可以将信息中心内的报告导出为逗号分隔值 (CSV) 文件。
如需获得查看“账单报告”信息中心所需的权限,请让您的组织 IAM 管理员为您授予 platform-obs 项目的相应项目查看者角色。
如需使用 kubectl CLI 访问“支出报告”信息中心并获取账单,请按以下步骤操作:
控制台
- 登录 GDC 控制台。
- 在导航菜单中,依次选择结算 > 报告。系统会打开结算报告页面。
- 在支出报告部分,点击查看信息中心,打开“支出报告”信息中心。
CLI
获取账单:
kubectl get invoice -n billing-system
“支出报告”信息中心包含以下表格和图表:
“支出报告”表格
支出报告表是一个表格,其中详细列出了账单的费用。支出报告表格会显示以下各列:
| 列 | 说明 |
|---|---|
| 账单 ID | 特定 invoice_line_item 的账单的唯一 ID。 |
| 结算账号 ID | 您的 GDC 账号 ID。 |
| SKU | SKU 所代表的含义的说明。 |
| SKU ID | 相应 SKU 的 ID 编号。 |
| 使用开始日期 | 开始特定invoice_line_item的月份的第一天。 |
| 使用结束日期 | 结束特定invoice_line_item的月份的最后一天。 |
| 单价(美元) | 以美元 (USD) 为单位的每单位费用。 例如,计算服务的单价取决于您使用的服务器数量。 |
| 使用量 | 您使用的每个单位的数量。 |
| 使用单位 | 您使用的单位类型。 |
| 费用 | 每个 SKU 的总费用(按行)。 |
按产品系列划分的总费用
按产品系列划分的总费用表格详细展示了相应账单的费用。按产品系列划分的总费用表格显示以下列:
| 列 | 说明 |
|---|---|
| 账单 ID | 特定 invoice_line_item 的账单的唯一 ID。 |
| 结算账号 ID | 您的 GDC 账号 ID。 |
| 付款账号 ID | 您组织付款账号的 ID。 |
| 产品系列 | 商品组类型。例如,计算。 |
| SKU | SKU 所代表的含义的说明。 |
| SKU ID | 相应 SKU 的 ID 编号。 |
| 费用 | 指定产品系列 SKU 的累计费用。 |
按云服务模式划分的总费用
按云服务模式划分的总费用表格详细展示了特定产品类型的费用。按云服务模式划分的总费用表显示以下列:
| 列 | 说明 |
|---|---|
| 账单 ID | 特定 invoice_line_item 的账单的唯一 ID。 |
| 结算账号 ID | 您的 GDC 账号 ID。 |
| 付款账号 ID | 您组织付款账号的 ID。 |
| 云服务模型 | 云服务类别。例如,IaaS |
| SKU | SKU 所代表的含义的说明。 |
| SKU ID | 相应 SKU 的 ID 编号。 |
| 费用 | 指定服务模式 SKU 的累计费用。 |
按月划分的费用
按月划分的费用图表以月度视图显示费用图表。 按月费用图表可让您了解费用逐月增加或减少的情况。监控实例默认将月度视图设置为全部。
如需按月自定义视图,请执行以下操作:
- 在菜单栏中,从 Timepicker(时间选择器)下拉菜单中设置首选时间范围。
- 选择您偏好的时间段。
累计总费用
累计总费用图表会按给定的时间轴显示累计总费用。
过滤账单数据
您可以通过菜单栏过滤“账单报告”信息中心内显示的值。借助菜单栏,您可以自定义账单表、“每月费用”和“累计总费用”部分中显示的值。菜单栏包含以下标签页:
| Tab | 说明 |
|---|---|
| 账单日期 | 一个下拉菜单,用于按首选日期过滤支出报告表格和总费用(美元)列。 |
| 结算账号 ID | 您的 GDC 账号 ID。 |
| SKU | 一个下拉菜单,可用于选择要查看的 SKU。 |
| 阈值(美元) | 您添加的输入字段,用于限制累计总费用图表的金额上限(以美元为单位)。 |
导出和打印账单
您可以通过信息中心界面将账单导出为可移植文档格式 (PDF),然后进行打印。
如需将账单导出为 PDF 并打印,请执行以下操作:
- 在导航菜单中,点击信息中心图标。
- 在结算文件夹中,选择支出报告信息中心。
在菜单栏中,从账单日期下拉菜单中选择账单日期,并从结算账号 ID 下拉菜单中选择结算账号 ID 编号。选择这些值后,信息中心会生成并自动填充以下输入字段:
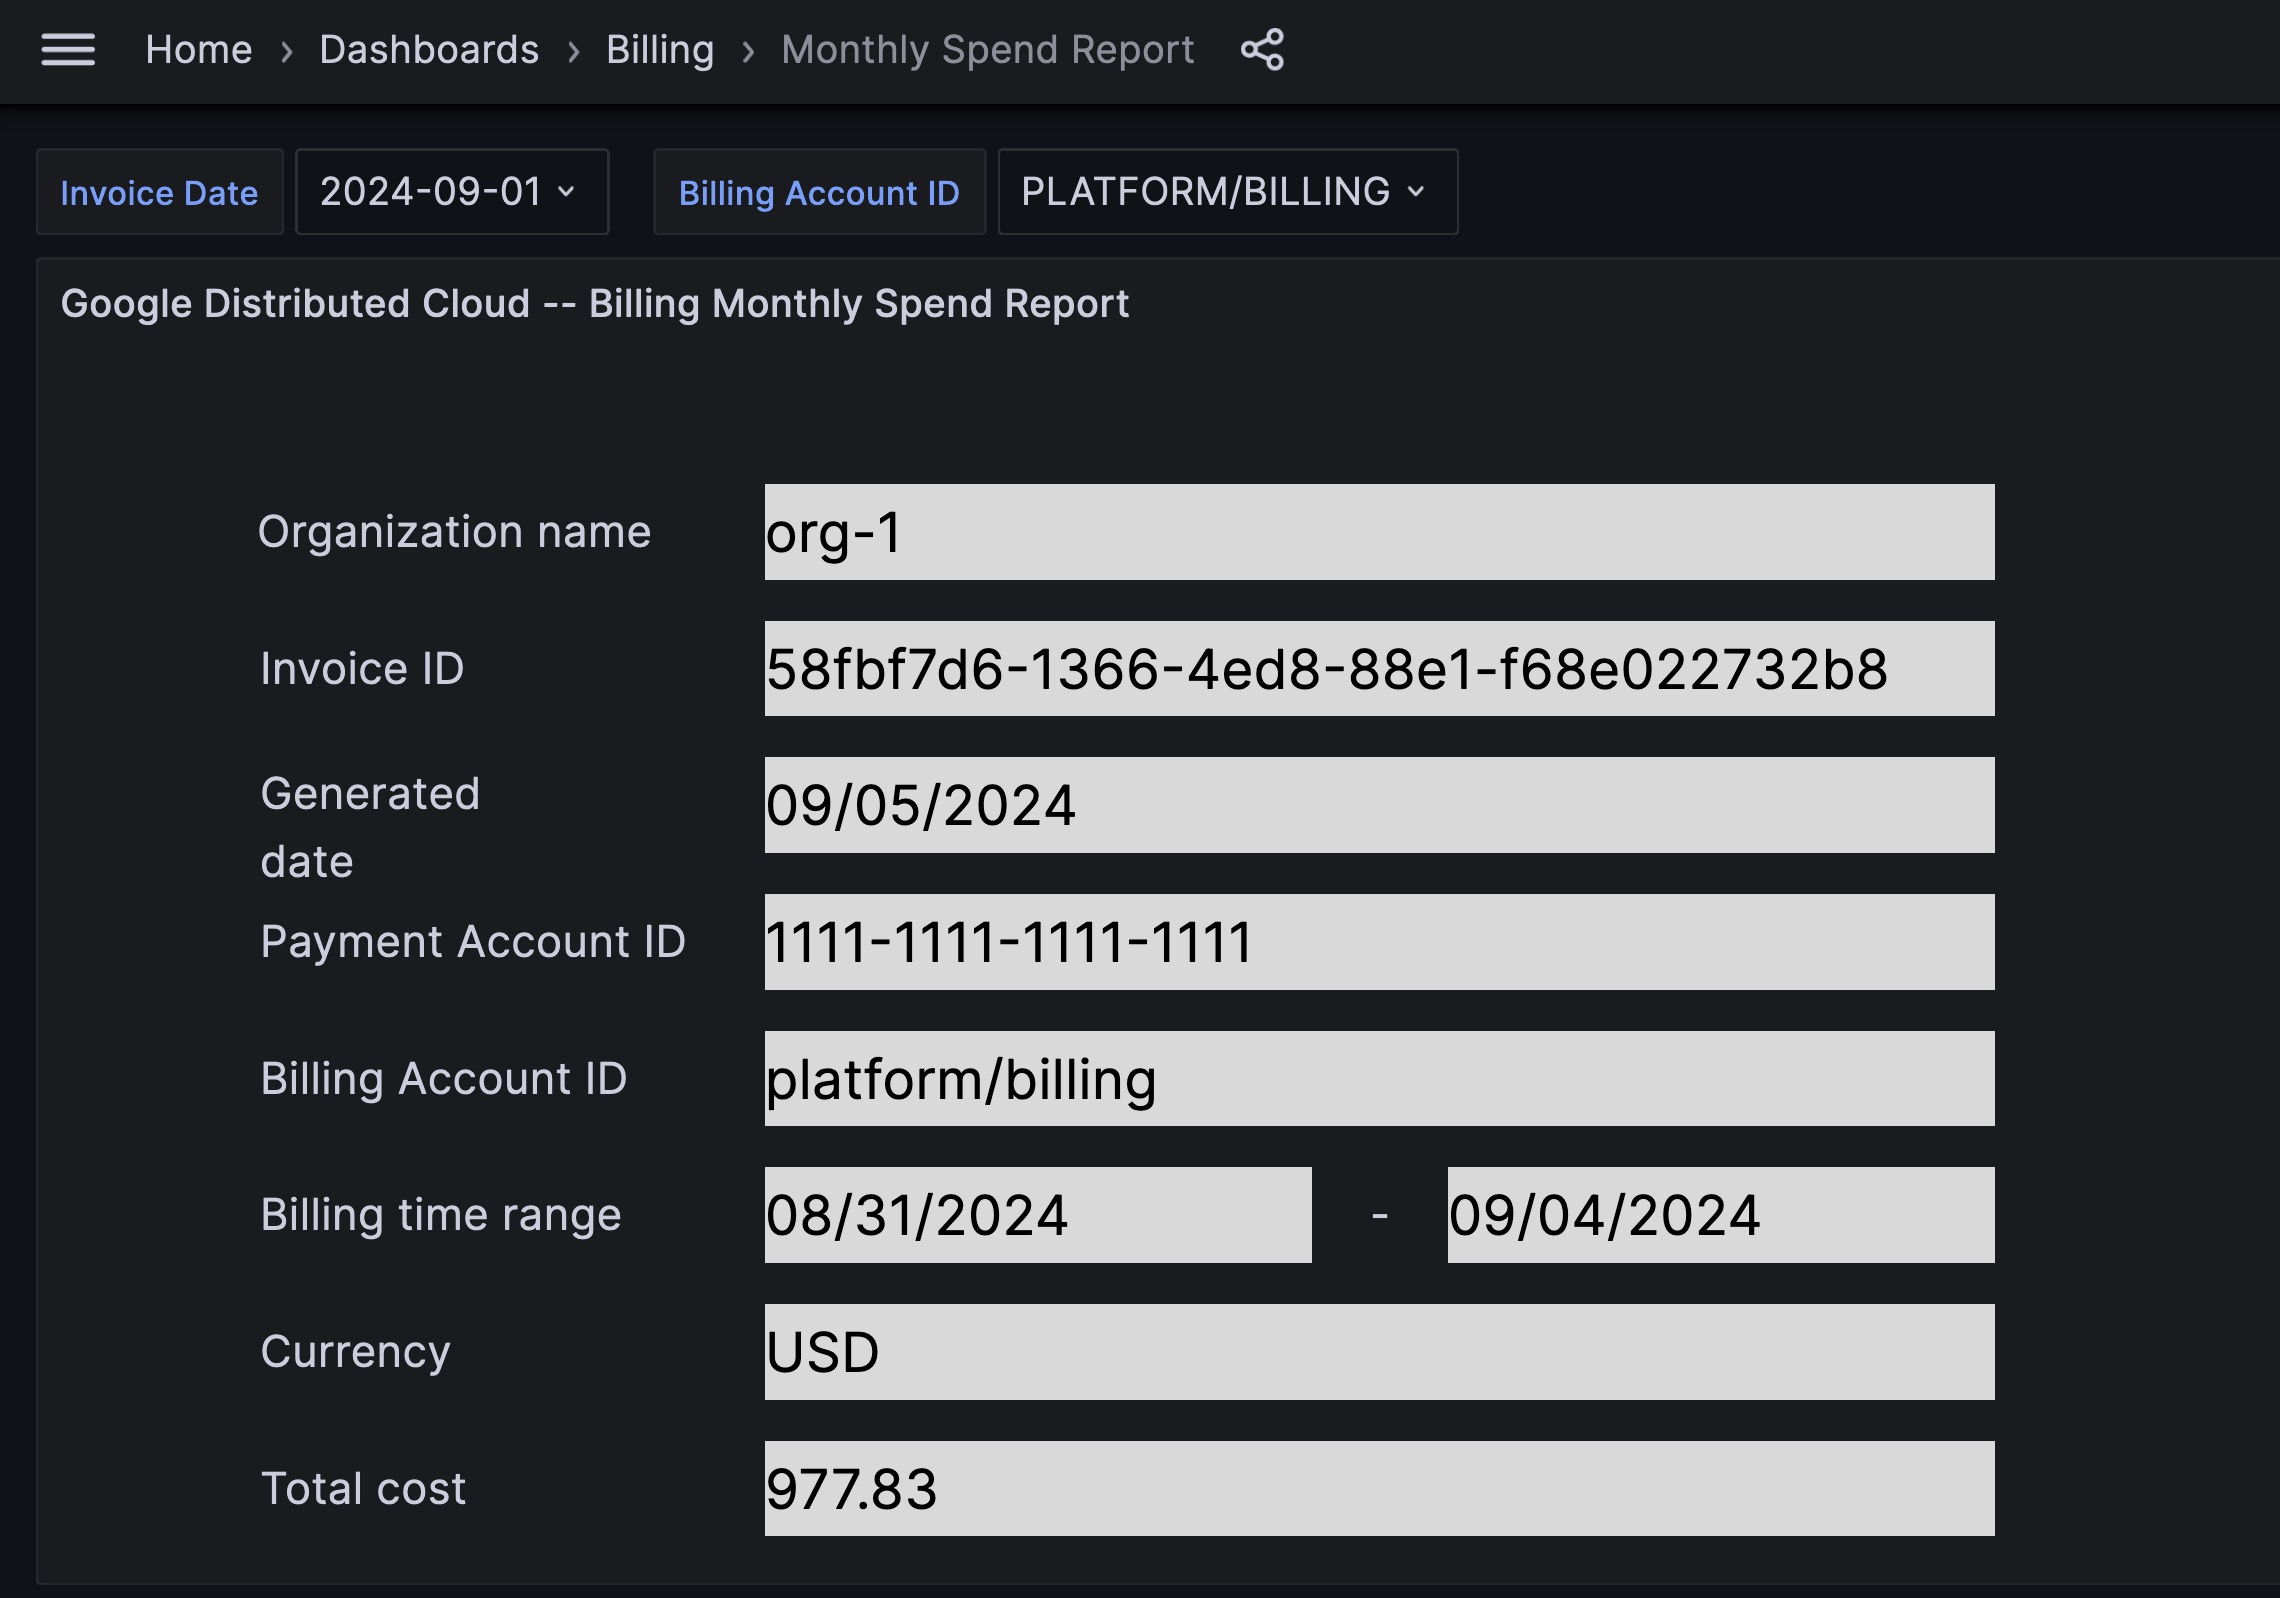
输入字段 说明 组织名称 您组织的名称。 账单 ID 账单的 ID。 生成日期 导出账单的创建日期。 付款账号 ID 您组织付款账号的 ID。 结算账号 ID 您的 GDC 账号 ID。 结算时间范围 您选择要导出的账单的日期。 货币 按国家/地区缩写的资产类型。例如:美元。 总费用 相应账单中所有 SKU 的累计费用。 在键盘上按
V可预览整个信息中心面板。按
CTRL + P或Command + P可打开浏览器的默认打印设置。选择另存为 PDF,将账单保存到您首选目录中的导出的 PDF 文件中。您可以随时打印此 PDF 文件。
