VM 層級指標資訊主頁會提供圖表,供您查看專案的 VM 專屬指標。從這個網址存取資訊主頁:
https://GDC_URL/PROJECT/grafana/d/h2Wx80n4k/workload-vms
- 將 GDC_URL 替換為 Google Distributed Cloud (GDC) 實體隔離環境中貴機構的網址。
- 將 PROJECT 替換為您的專案名稱。平台管理員的專案名稱為
platform-obs。
本頁面將概略說明 VM 資訊主頁,以及可從中存取的各種圖表提供的資訊類型。
VM 資訊主頁
VM 資訊主頁會顯示圖表,其中包含每個專案命名空間中各個 VM 的下列資訊:
這些圖表類型是使用 VM 監控指標產生。指標會根據類型、標籤和意義命名及說明。
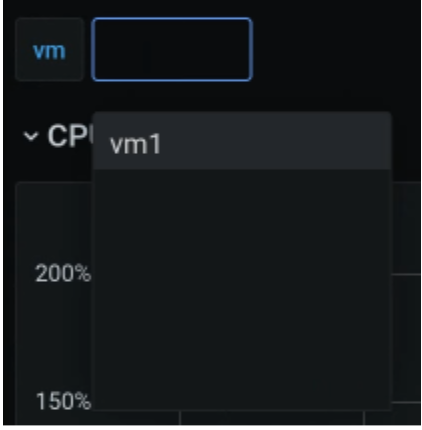
在資訊主頁檢視畫面中,從頁面開頭的選取方塊 (下圖中標示為「vm」) 選擇要觀察的 VM。圖片顯示已選取 vm1。
CPU
查看 CPU 使用率,也就是每個 vCPU 處於不同狀態的時間量。圖表會顯示機器類型指定的每個 vCPU 資訊。

記憶體
從記憶體圖表,查看 VM 分配到的記憶體總量、可用記憶體容量和記憶體用量等屬性。

網路
您可以在「網路」頁面查看下列資訊:
- 從網路接收及傳送的封包數。
- 從網路接收及傳送的位元組數量。
- 虛擬網路介面卡 (vNIC) 介面上捨棄的接收和傳輸封包數量。
- 網路傳輸錯誤封包數。

磁碟
查看「磁碟」頁面,瞭解下列資訊:
- 從磁碟讀取或寫入的位元組數
- 寫入或讀取 IO 作業的數量。
- 讀取或寫入作業的累計時間:
- 作業排入佇列的時間
- 實際執行作業所花費的時間 (磁碟忙碌)
- 磁碟排清要求數量,以及快取排清所花費的時間。

指標清單
如要查看指標定義清單,請前往「Virtual Machine Management (VMM)」 頁面查看清單。