虚拟机级指标信息中心提供图表,用于查看项目的虚拟机特定指标。通过以下地址访问信息中心:
https://GDC_URL/PROJECT/grafana/d/h2Wx80n4k/workload-vms
- 将 GDC_URL 替换为 Google Distributed Cloud (GDC) 网闸隔离环境中的组织网址。
- 将 PROJECT 替换为您的项目名称。平台管理员项目的名称为
platform-obs。
本页面简要介绍了虚拟机信息中心,以及可通过该信息中心访问的不同图表提供的信息类型。
虚拟机信息中心
虚拟机信息中心会显示一些图表,其中包含每个项目命名空间中每个虚拟机的以下相关信息:
这些图表类型是使用虚拟机监控指标生成的。指标的命名和说明依据其类型、标签和含义。
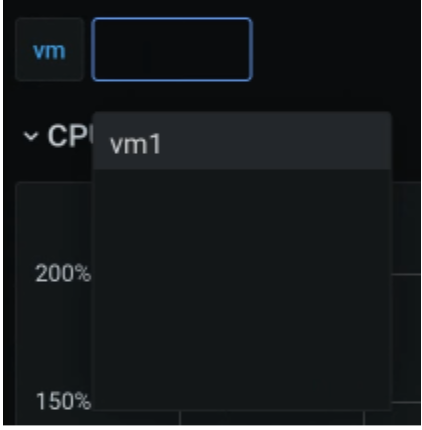
在信息中心视图中,从页面开头的选择框(在下图中标记为“虚拟机”)中选择要观察的虚拟机。该图片显示已选择 vm1。
CPU
查看 CPU 利用率 - 每个 vCPU 在不同状态下所花费的时间。该图表会显示机器类型指定的每个 vCPU 的信息。

内存
从内存图表中,您可以查看分配给虚拟机的总内存、可用内存量和正在使用的内存量等属性。

网络
您可以在“广告资源网”页面中查看以下信息:
- 从网络接收和发送的数据包数量。
- 从网络接收和发送的字节数。
- 虚拟网络接口卡 (vNIC) 接口上已丢弃的接收和传输数据包数量。
- 网络传输错误数据包数量。

磁盘
查看“磁盘”页面,了解以下信息:
- 从磁盘读取或写入磁盘的字节数
- 写入或读取 IO 操作的次数。
- 读取或写入操作所用的累计时间:
- 操作在队列中的时间
- 实际执行操作所花费的时间(磁盘忙碌)
- 磁盘刷新请求数,以及用于刷新缓存的时间。

指标列表
如需查看指标定义列表,请查看虚拟机管理 (VMM) 页面上的列表。