監控 Kubernetes 叢集健康狀態指標
KUB 元件的指標資訊主頁提供圖形資訊和視覺化面板,可供查看使用者叢集的健康狀態。
開啟下列網址,存取使用者叢集健康狀態資訊主頁:
https://GDC_URL/platform-obs/grafana/KUB-pa-cluster-metrics
將 GDC_URL 替換為 Google Distributed Cloud (GDC) 實體隔離環境中貴機構的網址。
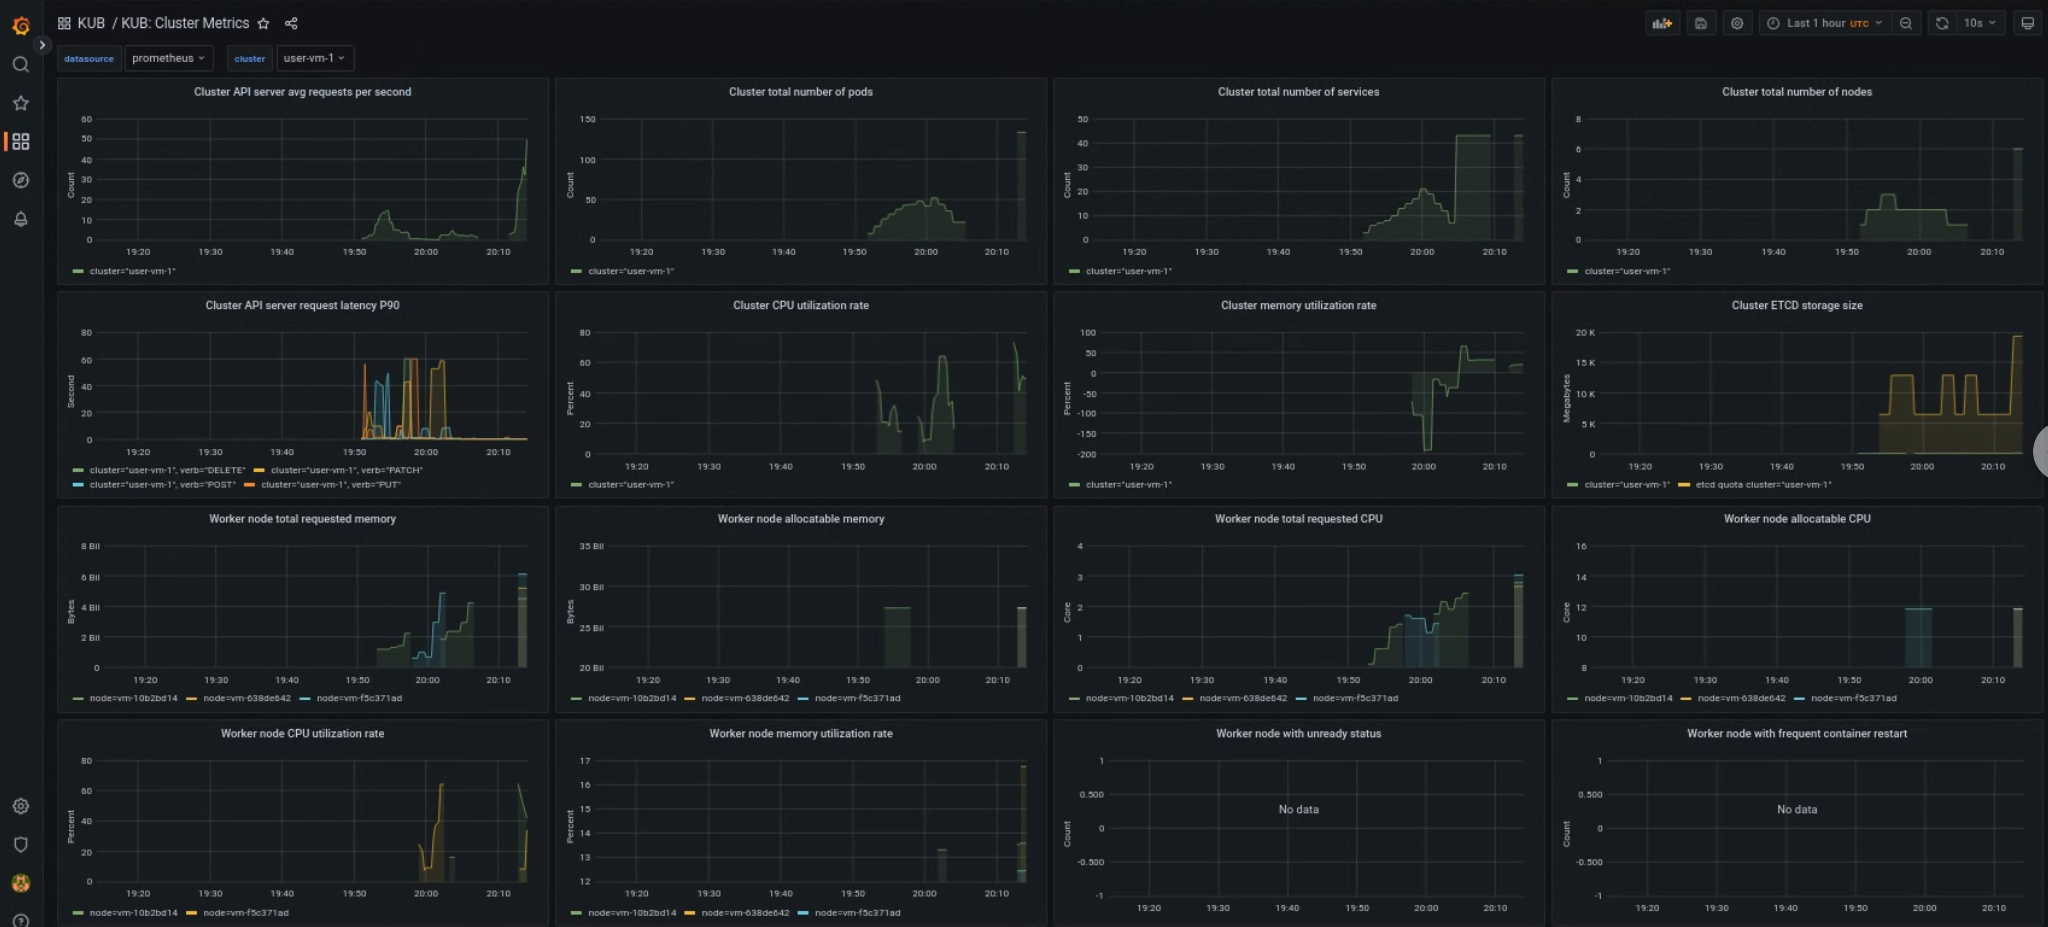
KUB 使用者叢集資訊主頁
KUB 資訊主頁會顯示圖表和視覺化面板,其中包含專案命名空間中使用者叢集的健康狀態資訊。
您可以查看使用者叢集的一般健康狀態,排解問題並找出叢集層級的潛在資源限制。
使用者叢集一般健康狀態
您可以在這個資訊主頁中,深入瞭解 Kubernetes 叢集的健康狀態,例如:
- API 伺服器流量和延遲時間
- 叢集 CPU 和記憶體用量
- 節點條件
除非另有註明,否則本頁面中的內容是採用創用 CC 姓名標示 4.0 授權,程式碼範例則為阿帕契 2.0 授權。詳情請參閱《Google Developers 網站政策》。Java 是 Oracle 和/或其關聯企業的註冊商標。
上次更新時間:2025-10-22 (世界標準時間)。
[[["容易理解","easyToUnderstand","thumb-up"],["確實解決了我的問題","solvedMyProblem","thumb-up"],["其他","otherUp","thumb-up"]],[["難以理解","hardToUnderstand","thumb-down"],["資訊或程式碼範例有誤","incorrectInformationOrSampleCode","thumb-down"],["缺少我需要的資訊/範例","missingTheInformationSamplesINeed","thumb-down"],["翻譯問題","translationIssue","thumb-down"],["其他","otherDown","thumb-down"]],["上次更新時間:2025-10-22 (世界標準時間)。"],[],[]]