透過 Managed Harbor Service (MHS) 元件的指標資訊主頁,您可以查看儲存空間用量和執行的安全漏洞掃描次數,並以圖表和視覺化面板呈現。
開啟下列網址,存取使用者叢集健康狀態資訊主頁:
https://GDC_URL/platform-obs/grafana/d/haas-billing/haas-billing-dashboard?orgId=ORG_ID
更改下列內容:
GDC_URL:Google Distributed Cloud (GDC) Air-Gapped 中貴機構的網址。ORG_ID:您在 GDC 中的機構 ID。
查看 MHS 指標資訊主頁
在這個資訊主頁中,您可以取得 Harbor 執行個體的寶貴洞察資料,例如:
- 執行的 Harbor 安全漏洞掃描次數。
- 已使用的物件儲存空間容量。
- Harbor 專案數量。
使用「Harbor 安全漏洞掃描」面板,查看您為 Harbor 執行安全漏洞掃描的次數。
使用「已使用的物件儲存空間容量」面板查看儲存空間用量指標,並測量您使用的物件儲存空間資源量。
使用「Harbor Projects」面板,查看 Harbor 執行個體中所有 Harbor 專案的計數。
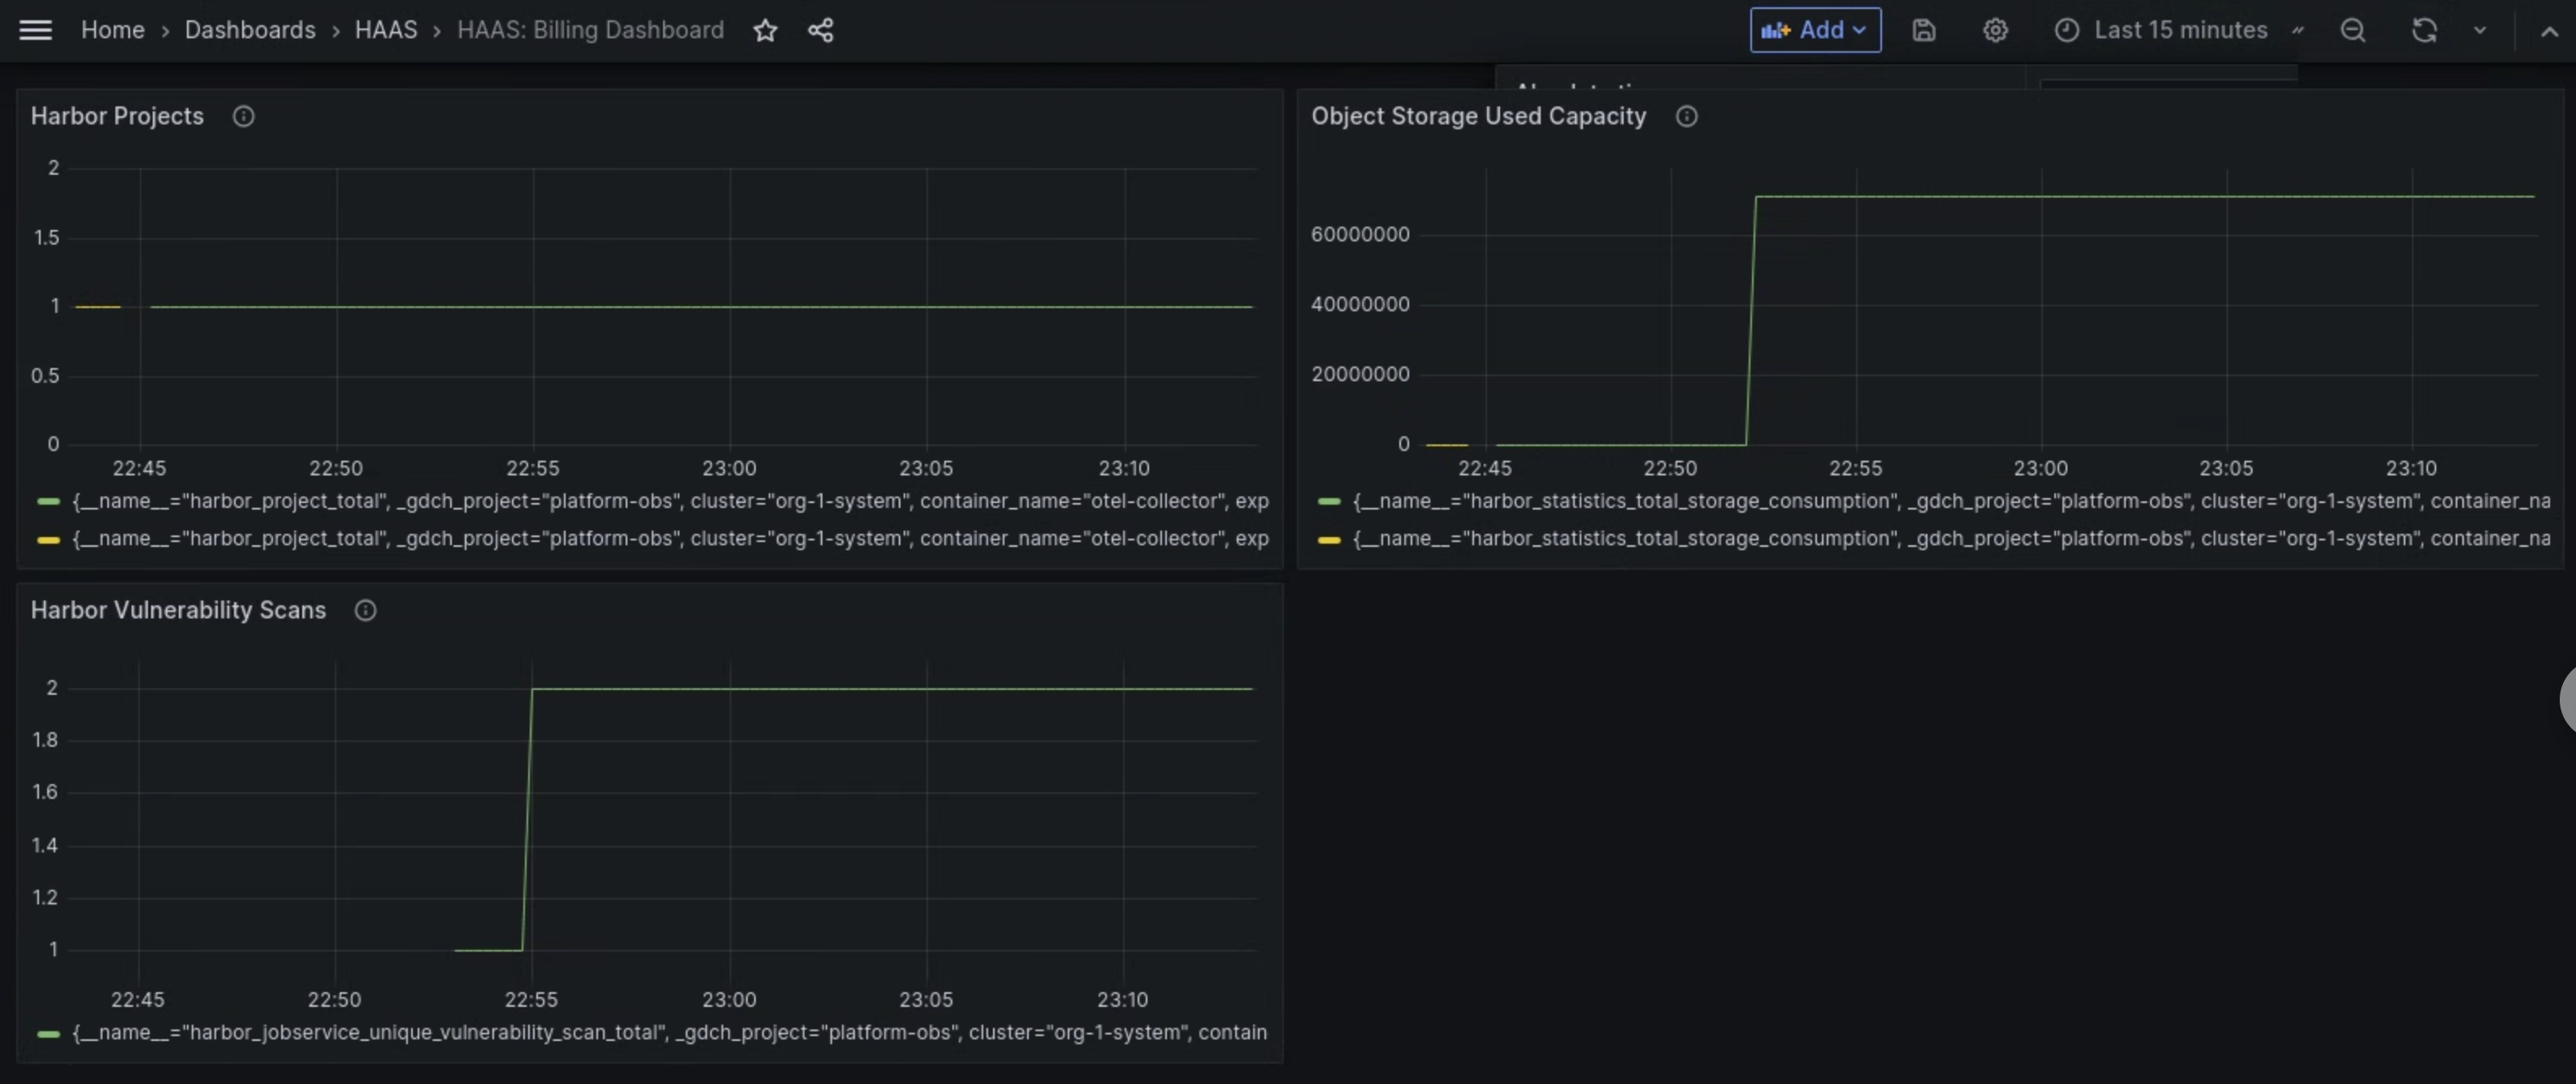
圖 1. 在 Grafana 中使用 MHS 資訊主頁,查看 Harbor 安全漏洞掃描、儲存空間用量和專案計數的指標。