借助日志和指标,您可以监控服务并排查服务性能方面的问题。您可以使用 Google Distributed Cloud (GDC) 空气隔离环境中的监控和日志记录资源,查看 Vertex AI 服务的日志和指标。您还可以创建查询来监控特定的 Vertex AI 指标。
本页介绍了如何在 Distributed Cloud 的监控实例。
此页面还包含一些示例查询,您可以使用这些查询来监控 Vertex AI 平台和服务,例如光学字符识别 (OCR)、Speech-to-Text 和 Vertex AI Translation。 如需详细了解 Distributed Cloud 中的日志记录和监控解决方案,请参阅监控指标和日志。
准备工作
如需获得查看 Vertex AI 日志和指标所需的权限,请让项目 IAM 管理员在项目命名空间中向您授予 Project Grafana Viewer (project-grafana-viewer) 角色。
如需详细了解此角色,请参阅准备 IAM 权限。
在信息中心内直观呈现日志和指标
您可以在信息中心内查看 Vertex AI 指标和日志。例如,您可以创建一个查询来查看 Vertex AI 对 CPU 使用率的影响。
请按照以下步骤在信息中心内查看 Vertex AI 日志和指标:
在导航菜单中,依次点击 Vertex AI > 预训练 API。
在预训练 API 页面上,确保您要监控的服务的 Vertex AI API 已启用。
点击 Monitor services in Grafana(在 Grafana 中监控服务)以打开 Grafana 首页。
在首页的导航菜单中,依次点击探索 探索,打开探索页面。
在探索页面上的菜单中,选择以下数据源之一:
- 运维日志:检索运维日志。
- 审核日志:检索审核日志。
- Prometheus:检索指标。
如果您想显示指标,请使用 PromQL(Prometheus 查询语言)表达式输入查询。
如果您想显示日志,请使用 LogQL(日志查询语言)表达式输入查询。
该页面会显示与您的查询匹配的指标或日志。
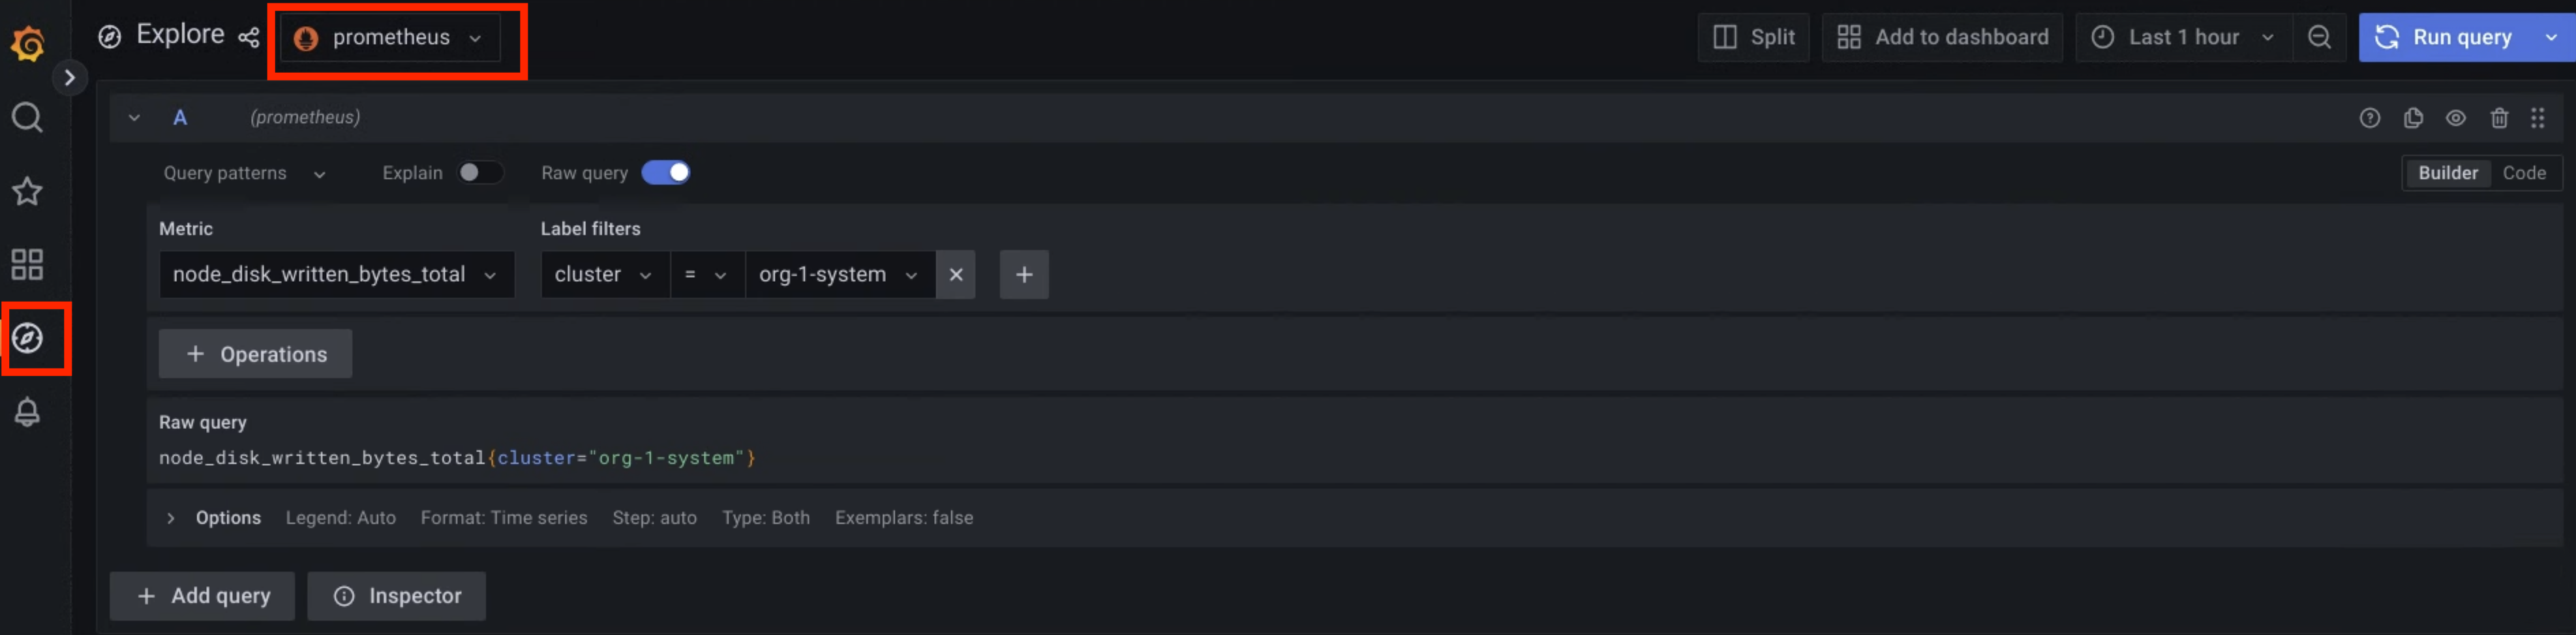
图 1. Grafana 中用于查询指标的菜单选项。
在图 1 中,Prometheus 选项会显示一个界面,您可以在其中构建查询来检索指标。
查询示例
下表包含用于监控环境中的 Vertex AI 平台的查询示例:
| Vertex AI 平台 | |||
|---|---|---|---|
| 数据源 | 说明 | 组件 | 查询 |
| 指标 | 容器的 CPU 使用率百分比 | 1 级运营商 | rate(container_cpu_usage_seconds_total{namespace="ai-system",container="l1operator"}[30s]) * 100 |
| 2 级运营商 | rate(container_cpu_usage_seconds_total{namespace="ai-system",container="l2operator"}[30s]) * 100 |
||
| 容器的内存用量(以 MB 为单位) | 1 级运营商 | container_memory_usage_bytes{namespace="ai-system",container="l1operator"} * 1e-6 |
|
| 2 级运营商 | container_memory_usage_bytes{namespace="ai-system",container="l2operator"} * 1e-6 |
||
| 运维日志 | L1 操作员日志 | 1 级运营商 | {service_name="vai-l1operator"} |
| L2 操作员日志 | 2 级运营商 | {service_name="vai-l2operator"} |
|
| 审核日志 | 平台前端审核日志 | Vertex AI Web 插件前端 | {service_name="istio"} |~ upstream_cluster:.*(vai-web-plugin-frontend) |
| 平台后端审核日志 | Vertex AI Web 插件后端 | {service_name="istio"} |~ upstream_cluster:.*(vai-web-plugin-backend) |
|
下表包含一些示例查询,可用于监控您环境中的 Vertex AI API 服务,例如 OCR、Speech-to-Text 和 Vertex AI Translation:
| Vertex AI 服务 | |||
|---|---|---|---|
| 数据源 | 说明 | 服务 | 查询 |
| 指标 | 预训练 API 对 CPU 使用率的影响。 |
OCR | rate(container_cpu_usage_seconds_total{namespace="g-vai-ocr-sie",container="CONTAINER_NAME"}[30s]) * 100 CONTAINER_NAME values: vision-extractor | vision-frontend | vision-vms-ocr |
| Speech-to-Text | rate(container_cpu_usage_seconds_total{namespace="g-vai-speech-sie",container="CONTAINER_NAME"}[30s]) * 100 |
||
| Vertex AI Translation | rate(container_cpu_usage_seconds_total{namespace="g-vai-translation-sie",container="CONTAINER_NAME"}[30s]) * 100 CONTAINER_NAME values: translation-aligner | translation-frontend | translation-prediction |
||
使用 destination_service 过滤条件标签可获取过去 60 分钟内的错误率。 |
OCR | rate(istio_requests_total{destination_service=~".*g-vai-ocr-sie.svc.cluster.local",response_code=~"[4-5][0-9][0-9]"}[60m]) |
|
| Speech-to-Text | rate(istio_requests_total{destination_service=~".*g-vai-speech-sie.svc.cluster.local",response_code=~"[4-5][0-9][0-9]"}[60m]) |
||
| Vertex AI Translation | rate(istio_requests_total{destination_service=~".*g-vai-translation-sie.svc.cluster.local",response_code=~"[4-5][0-9][0-9]"}[60m]) |
||
| 运维日志 | 来自 Vertex AI 服务 的操作日志 |
OCR | {namespace="g-vai-ocr-sie"} |
| Speech-to-Text | {namespace="g-vai-speech-sie"} |
||
| Vertex AI Translation | {namespace="g-vai-translation-sie"} |
||
| 审核日志 | Vertex AI 服务的审核日志 | OCR | {service_name="istio"} |= "vision-frontend-server" |
| Speech-to-Text | {service_name="istio"} |= "speech-frontend-server" |
||
| Vertex AI Translation | {service_name="istio"} |= "translation-frontend-server" |
||