Investigate a user
Google Security Operations User view enables customers to better understand how users within an enterprise are impacted by security events. By focusing on the behavior of individual users, security administrators can search for activity indicating an account compromise or other security concerns. Make sure you are ingesting and normalizing data from devices on your network, such as EDR, firewall, web proxy, user context, and authentication, etc.
Search for a user
To open User view in Google SecOps, enter the username or email address of a user within your enterprise in the Search field. If the user is present within your Google SecOps account, that user is displayed as a result. Click the username to pivot to User view.
User view aliasing
User view includes a user aliasing feature to ensure events associated with a
single user are not duplicated and are easier to search within your
Google SecOps account. For example, if you have an employee named Dennis
whose user identifier is dennis and whose email is dennis@altostrat.com and
you search for dennis in Google SecOps, events for both dennis and
dennis@altostrat.com are returned.
User view features
User view includes many features and user interface controls to enable you to more closely examine the user data within your enterprise. Some of these features are unique to User view and some are shared with the other Google SecOps event views (Domain View, IP Address View, etc.).
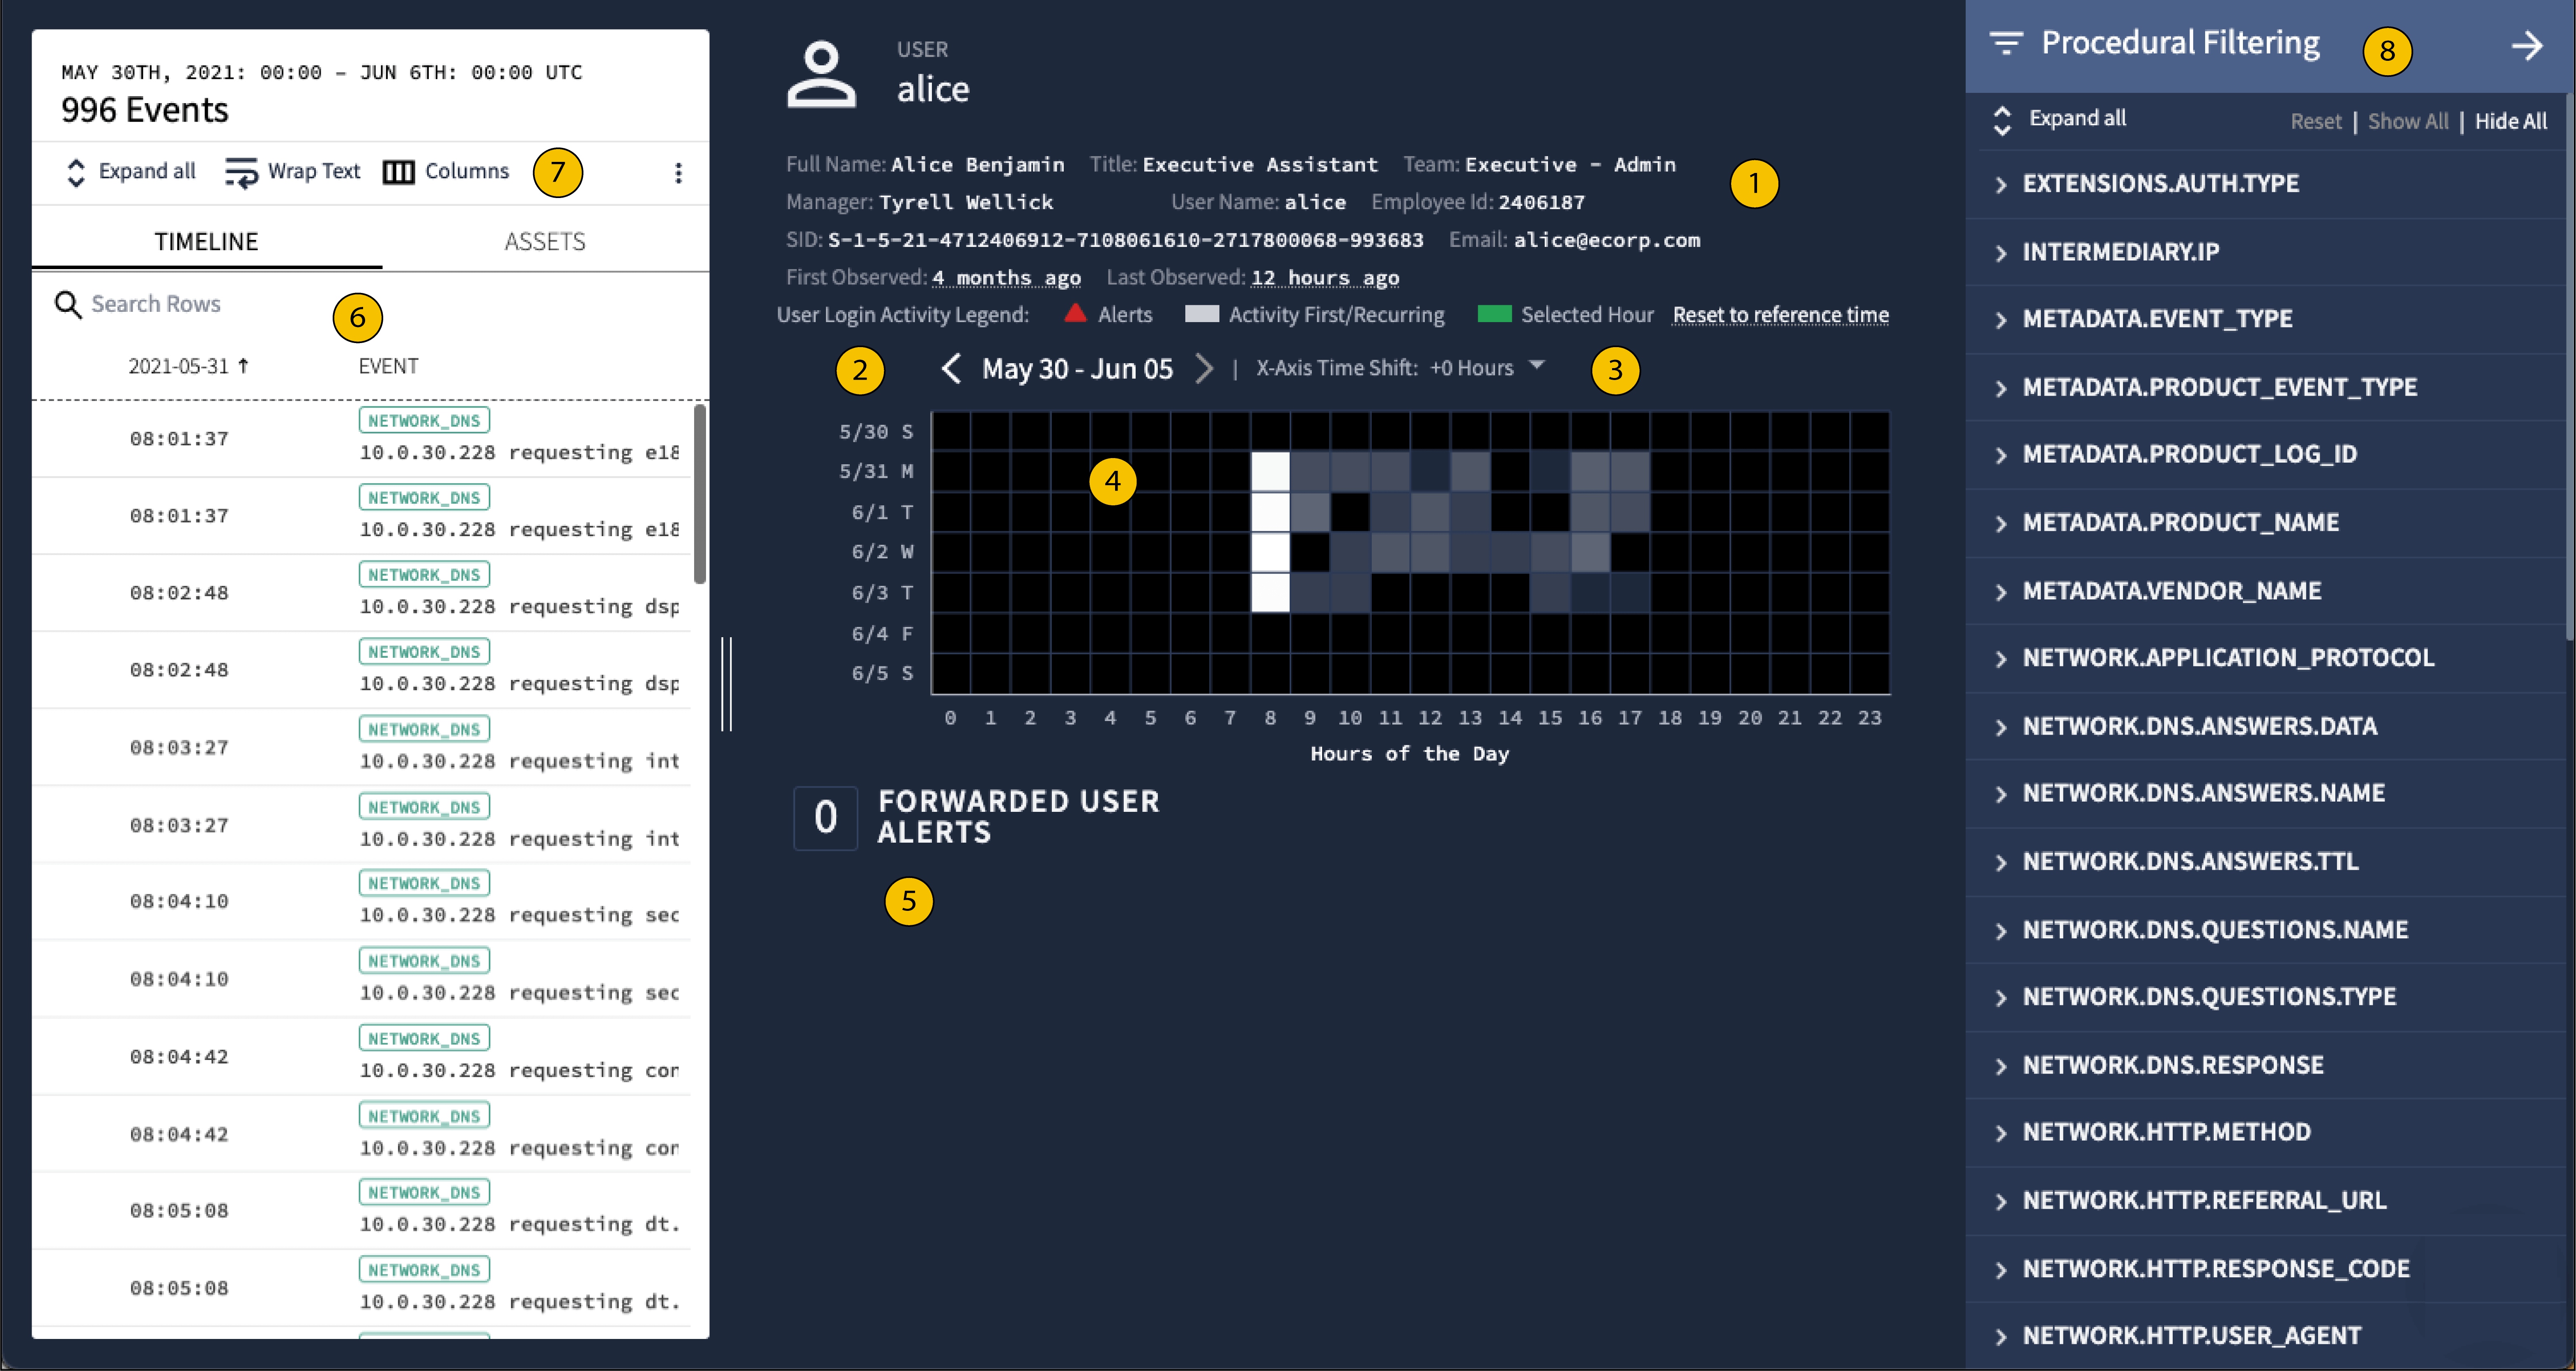 Google SecOps User view features
1 User information
Displays information about the user stored within your enterprise IT systems (for example, Active Directory, Workday, Okta, etc.).
2 Date selection
Use the left and right arrows to examine the events associated with the user over a one calendar week interval (Saturday through Sunday). If no data is available in the displayed time period, you are given First Seen and Last Seen options to shift the view quickly to a relevant time period.
3 X-axis time shift
By default, User view centers the Gradient Heat Map at 12:00 UTC (noon). Using the X-Axis Time Shift control, you can center the Heat Map up to 12 hours before or after 12:00. This lets you focus on atypical time periods for the user. For example, you could time shift the display to 0:00 UTC (midnight) to focus on user activity in the late evening and early morning hours as shown in these figures.
 Setting X-Axis time shift to +12
4 Gradient heat map
User view Gradient Heat Map displays an aggregate view of user activity across the time period you are investigating. Each square indicates an hour of the day (UTC) for a logged user activity across the time period. This chart lets you to locate unusual or atypical user activity.
Clicking on a square shows the activity date and clicking on that date from the green popover takes you to that hour of events in the Timeline.
The color of each square varies from black through shades of gray to white:
Black squares indicate no user activity.
White squares indicate frequent user activity.
Dark gray to light gray squares indicate increasing levels of activity with dark shades of gray representing less activity and light shades of gray representing more.
For example, a user is routinely active during normal work hours and never active late at night or on weekends. However, this user has recently become active every day at 3AM. The Gradient Heat Map lets you to quickly locate this type of atypical activity.
5 User alerts
User security alerts are captured by Google SecOps and displayed here. You can click the associated links to further investigate the alert.
7 Columns
Customize the columns displayed in the Timeline tab.
6 Timeline and assets
The Timeline and Assets tabs are also available within User view. As with other Google SecOps views, the Timeline tab lists events chronologically and the Assets tab lists the assets associated with the user alphabetically or numerically. The assets displayed correspond to this specific user's activity within your enterprise and is limited by the time period specified.
Use these tabs as follows:
Timeline tab: Selecting an event in the Timeline tab also highlights the corresponding event in the Gradient Heat Map in green. Alerts are indicated by a red triangle and red text.
Asset tab: Selecting an asset highlights it in green in the Asset tab and all activity involving that asset is also highlighted in green in the Gradient Heat Map. You can pivot to Asset view by clicking on the first accessed or last accessed in the Assets tab.
8 Procedural filtering
You can open the Procedural Filtering menu by clicking the Procedural Filtering icon in User view and filter the user information based on a variety of characteristics. For example, you could filter on Principal Location to examine the geographic location of the user's login attempts. It might indicate that a user is logging in from unusual locations.
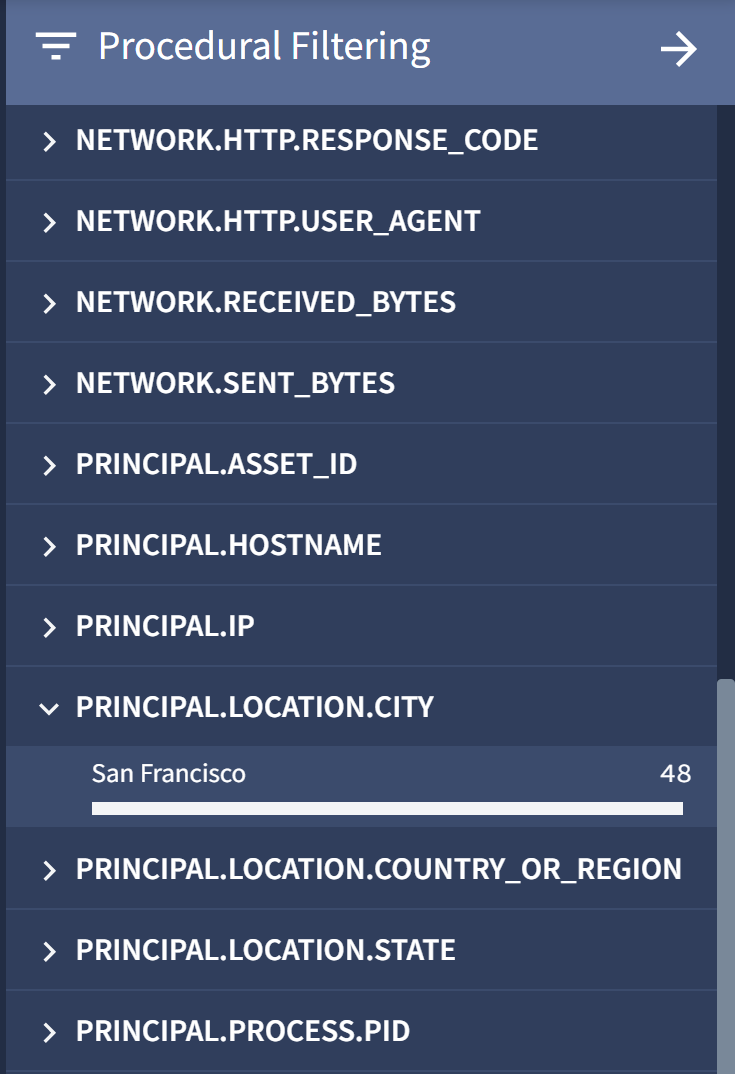
Procedural filtering on principal location
Considerations
User view has the following limitations:
- Only 80k events can be displayed in this view.
- You can only filter events that are displayed in this view.
- Only User, Email, and DNS event types are populated in this view. The first seen and last seen information populated in this view is also limited to these event types.
- Generic events don't appear in any of the curated views. They appear only in raw log and UDM searches.
Need more help? Get answers from Community members and Google SecOps professionals.