Looker ダッシュボードに画像を追加するには、Markdown テキストタイルに画像 URL をハードコードします。ただし、テキストタイルの画像は静的であり、結果に基づいて更新されません。ユーザーが選択したフィルタ値に基づいてダッシュボードの画像を動的に変更したい場合はどうすればよいでしょうか。
このベスト プラクティス ページでは、Liquid と html パラメータを使用して動的ダッシュボード画像を作成する方法を示しています。
ソリューション
次のソリューションは、架空の e コマース データセット内の状態を表す users.state というフィールドを含む e コマース データセットに基づいています。
dimension: state {
  type: string
  sql: ${TABLE}.state ;;
}
たとえば、ユーザーがダッシュボードの結果をフィルタするために選択する状態に基づいて更新されるダッシュボードに、状態フラグの画像を表示するとします。
動的ダッシュボード イメージを作成するには、次の 3 つのステップを完了する必要があります。
- LookML で画像ディメンションを作成します。
- 動的な画像のダッシュボード タイルを作成します。
- ダッシュボードのフィルタと最後の処理を追加します。
ステップ 1: LookML で画像ディメンションを作成する
LookML で画像ディメンションを作成するには:
- まず、プロジェクトに移動し、画像を追加するディメンションを含むファイルを表示します。次に、そのフィールドに基づいて、特に画像を表示するために使用する新しいディメンションを作成します。
-
画像を表示する値ごとに、
value変数を使用して Liquid{% if %}条件文を定義するためのhtmlパラメータを追加します。たとえば、次の
state_flag_imageディメンションは、stateの値が"California"、"New York"、"Colorado"、"Illinois"の場合に、指定した画像(html <img>タグ付き)を表示する条件を確立します。それ以外の状態では、「画像がありません」アイコンを表示できます。dimension: state_flag_image { type: string sql: ${state} ;; html: {% if state._value == "California" %} <img src="https://upload.wikimedia.org/wikipedia/commons/0/01/Flag_of_California.svg" height="170" width="255"> {% elsif state._value == "New York" %} <img src="https://upload.wikimedia.org/wikipedia/commons/thumb/1/1a/Flag_of_New_York.svg/1200px-Flag_of_New_York.svg.png" height="170" width="255"> {% elsif state._value == "Colorado" %} <img src="https://upload.wikimedia.org/wikipedia/commons/thumb/4/46/Flag_of_Colorado.svg/255px-Flag_of_Colorado.svg.png" height="170" width="255"> {% elsif state._value == "Illinois"%} <img src="https://upload.wikimedia.org/wikipedia/commons/thumb/0/01/Flag_of_Illinois.svg/1200px-Flag_of_Illinois.svg.png" height="170" width="255"> {% else %} <img src="https://upload.wikimedia.org/wikipedia/commons/thumb/a/ac/No_image_available.svg/1024px-No_image_available.svg.png" height="170" width="170"> {% endif %} ;; } -
画像を表示する値ごとに値条件を作成します。または、ビジュアリゼーションに画像を追加する方法のコミュニティ投稿で説明されているように、
valueLiquid 変数を使用して動的画像フィールドを作成することもできます。
次に、画像ディメンションのダッシュボード タイルを作成できます。
ステップ 2: 動的画像のダッシュボード タイルを作成する
画像ディメンション(state_flag_image)が作成されたので、動的画像ダッシュボード タイルになる Explore を作成できます。
次の基準で Explore を作成します。
-
元のディメンション(この場合は
state)のフィルタを追加します。フィルタに任意の値を設定します。特定のフィルタ値が選択されていないため、最初は「画像がありません」の画像が表示されます。このフィルタ値は、ユーザーがダッシュボードフィルタで選択した内容に応じて更新されます。 -
画像のディメンション(この場合は
state_flag_image)と、画像を決定するクエリに必要なその他のディメンション(たとえば、日付を考慮する場合は日付を追加する)を選択します。 - 行の上限を 1 行に変更します。
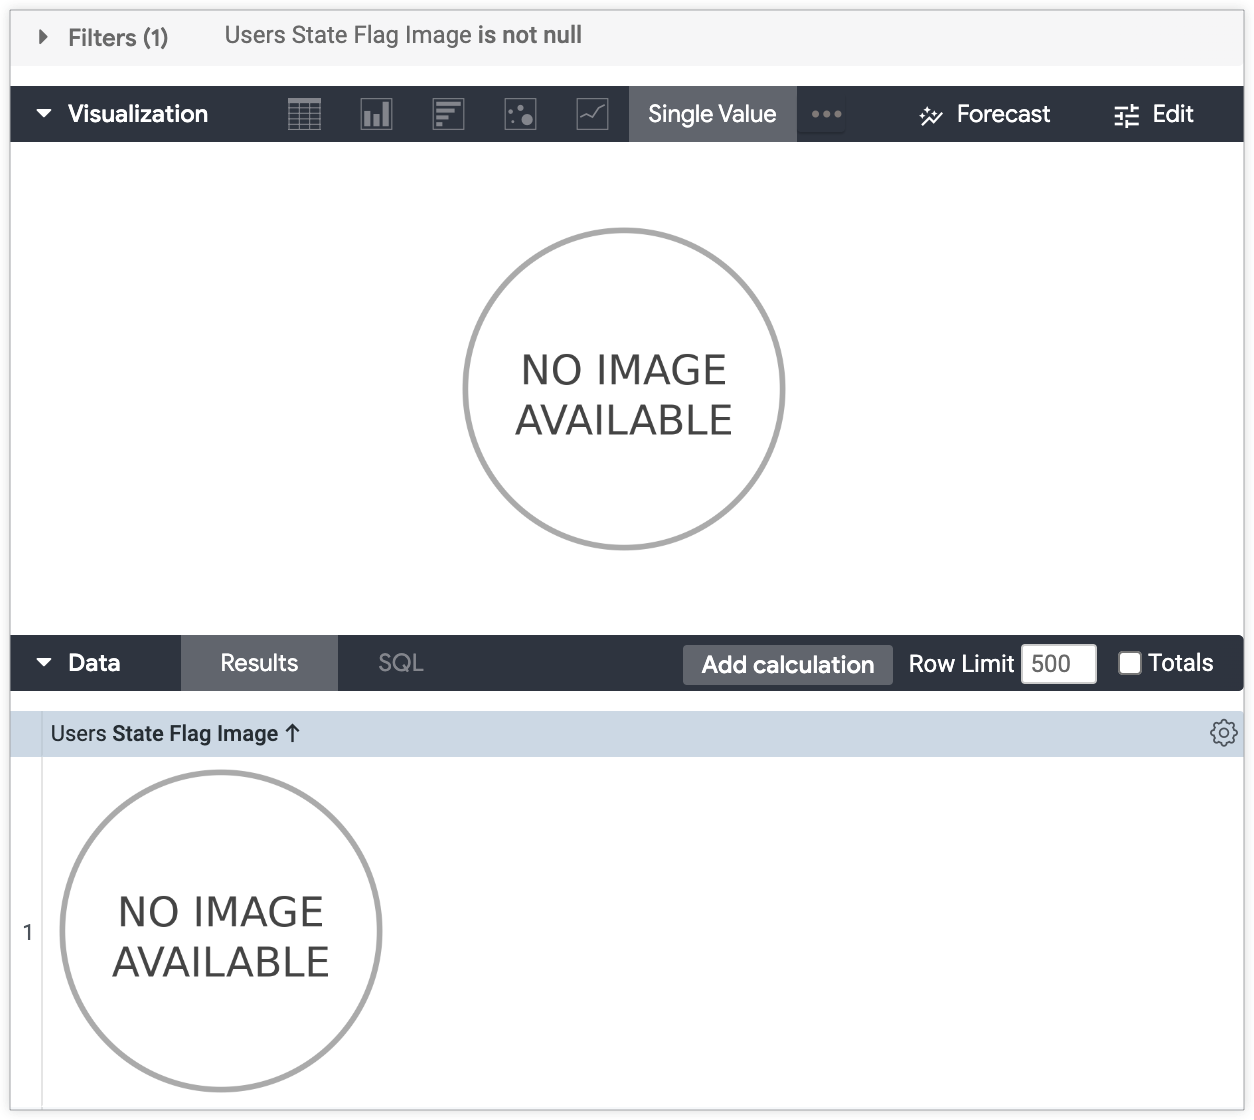
-
ビジュアリゼーション タイプを単一値のビジュアリゼーションに変更し、画像ディメンション(
state_flag_image)以外の他の列は非表示にします。
Explore には、[ビジュアリゼーション] パネルにレンダリングされた単一値のビジュアリゼーションで、最初は「画像なし」の画像が表示されます。表示画像は、ユーザーが最後のダッシュボードで選択したフィルタ値に基づいて変更されます。
Explore をタイルとしてダッシュボードに保存します。
ステップ 3: ダッシュボード フィルタと最後の処理を追加する
次に、ダッシュボードにダッシュボードフィルタを追加する必要があります。ダッシュボードのフィルタにより、Explore のフィルタが更新され、ユーザーの選択に基づいて表示される画像が変更されます。
ダッシュボードの編集モードでフィルタを作成します。
- [フィルタの追加] ウィンドウを開きます。
- フィルタリングで使用するフィールドを選択します。フィルタ フィールドは、画像ディメンションの基になるディメンションにする必要があります。この例では、フィルタのフィールドは state になります。
- [更新するタイル] タブのステップ 2 の画像タイルを選択します。
- インラインの [フィルタするフィールド] プルダウン メニューで元のディメンション(この場合は state)を選択します。 必要に応じて、更新する他のタイルを選択します。
- 必要に応じてフィルタをカスタマイズします。もし詳細 制御オプションを使用するには、詳細コントロール オプション向けに複数のフィルタを許可するオプションが自動的に有効になります。
これで、ユーザー フィルタの選択に応じて画像タイルが更新されます。
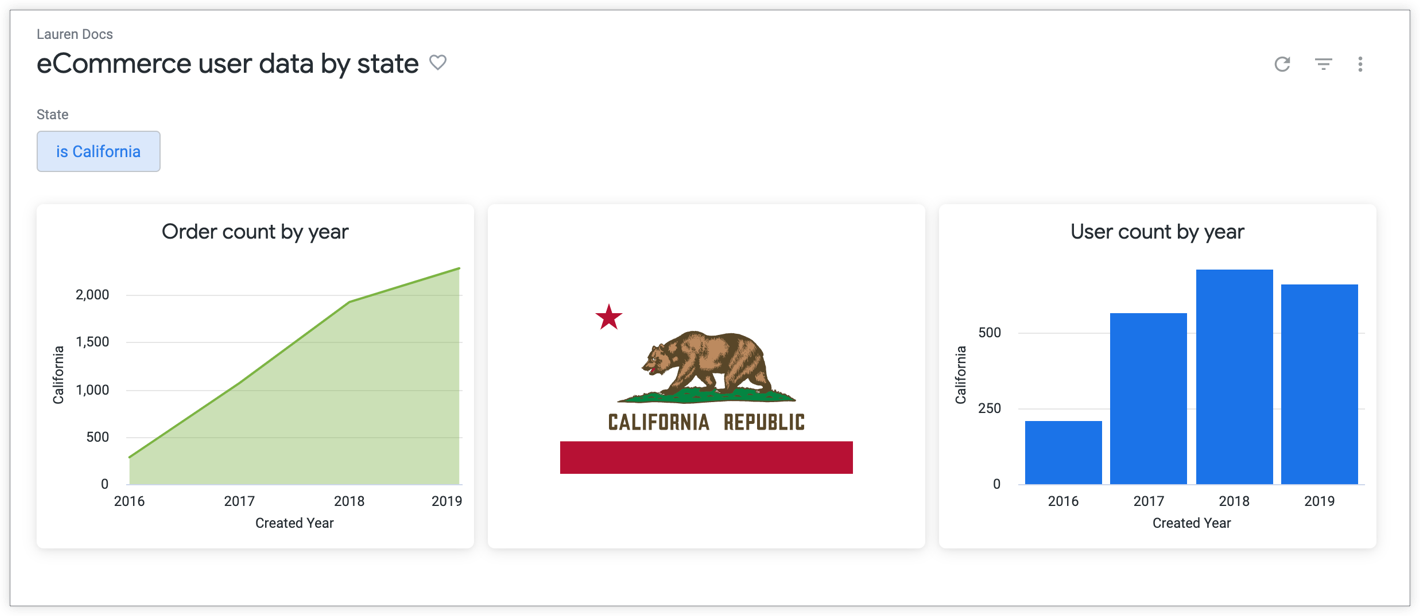
ユーザーが「California」でフィルタすることを選択すると、ダッシュボードにはカリフォルニア州の state フラグとデータが表示されます。
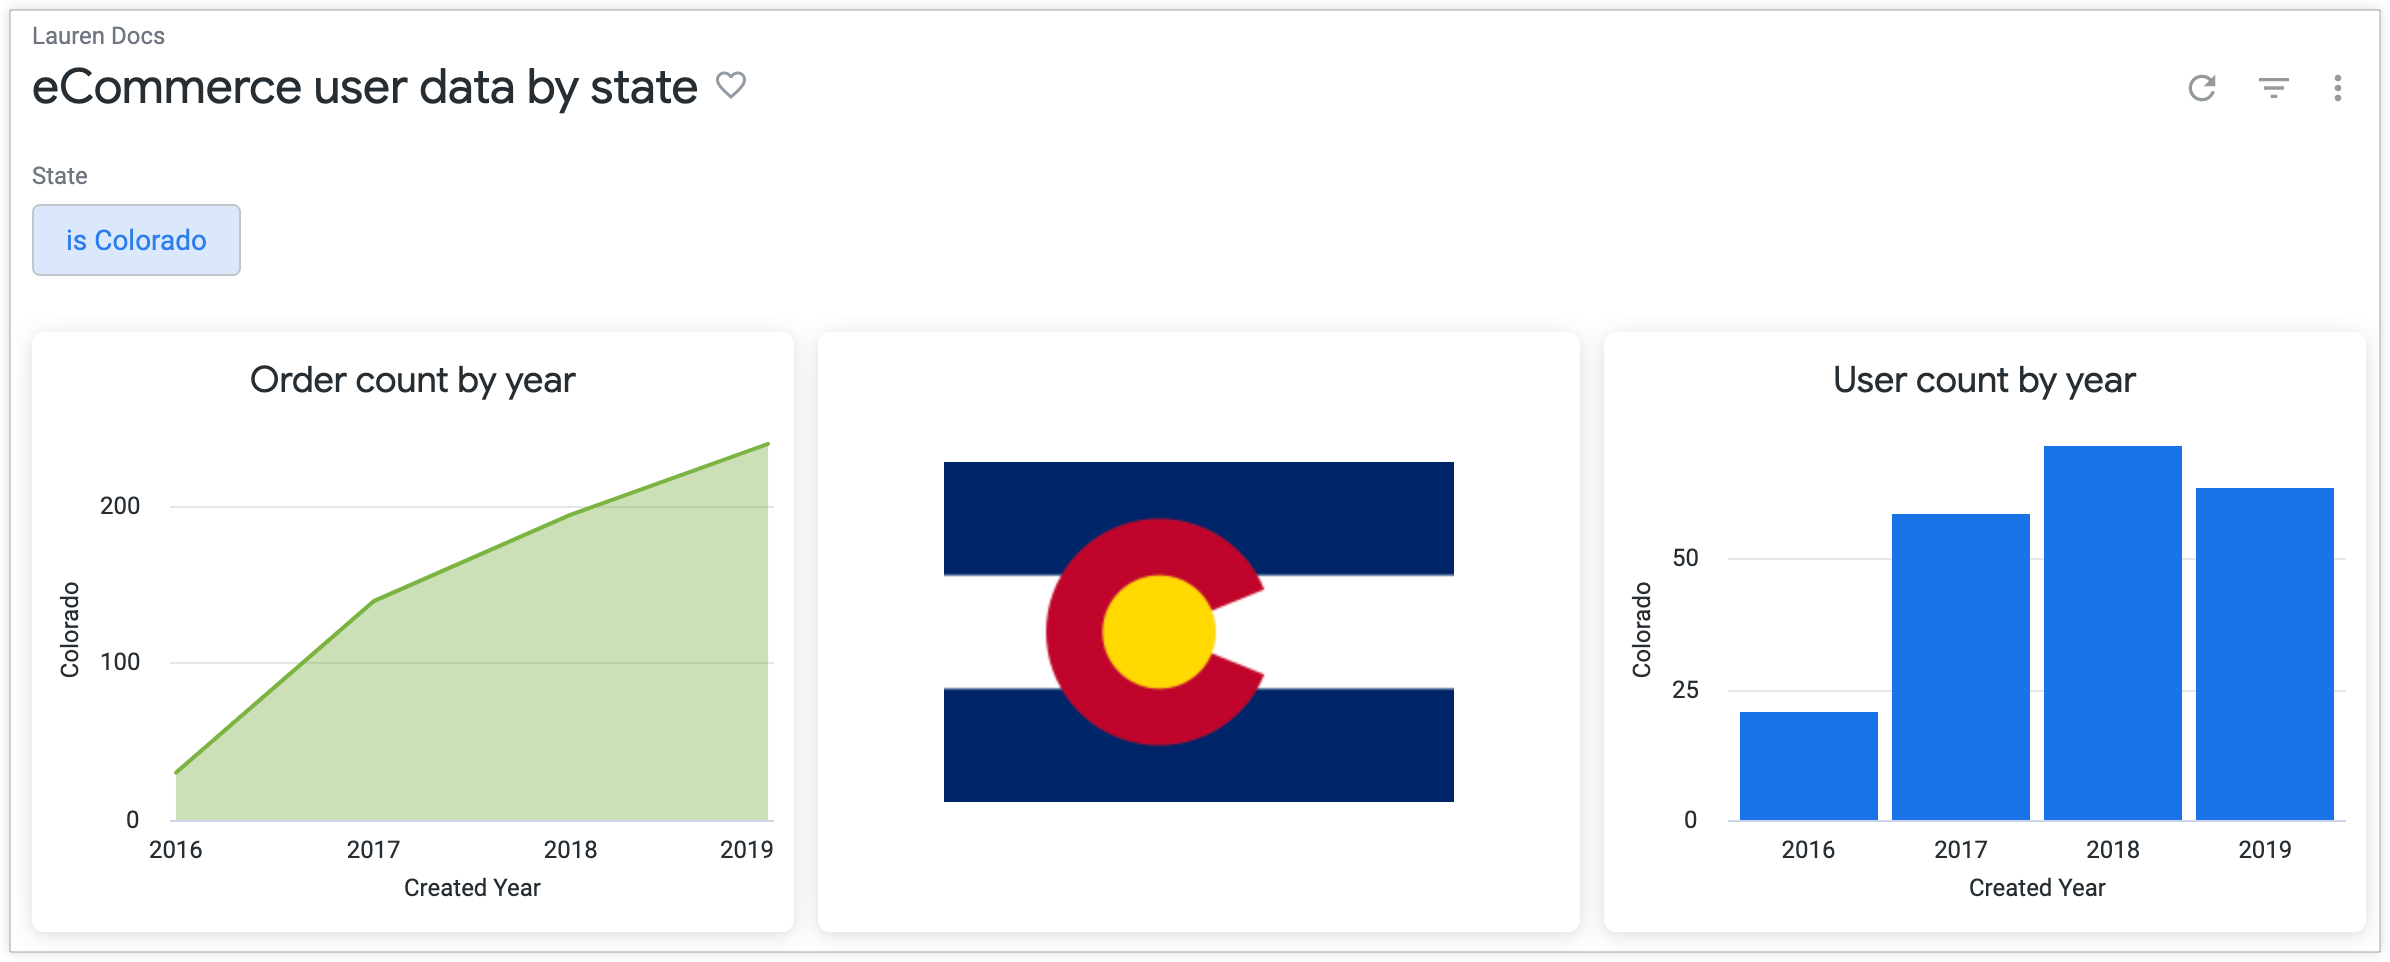
ユーザーが「Colorado」でフィルタすることを選択すると、ダッシュボードにはコロラド州のフラグとデータが表示されます。