Tetap teratur dengan koleksi
Simpan dan kategorikan konten berdasarkan preferensi Anda.
Lihat penggunaan setiap resource melalui dasbor Laporan penagihan.
Dasbor ini tersedia untuk melacak penggunaan resource Anda selama jangka waktu tertentu, dan membantu Anda mengelola resource secara efektif.
Untuk mendapatkan izin yang diperlukan guna melihat dasbor Penggunaan Penagihan, minta Admin IAM Organisasi Anda untuk memberi Anda peran pelihat yang sesuai untuk project Anda.
Dasbor Penggunaan Penagihan terdiri dari hal berikut:
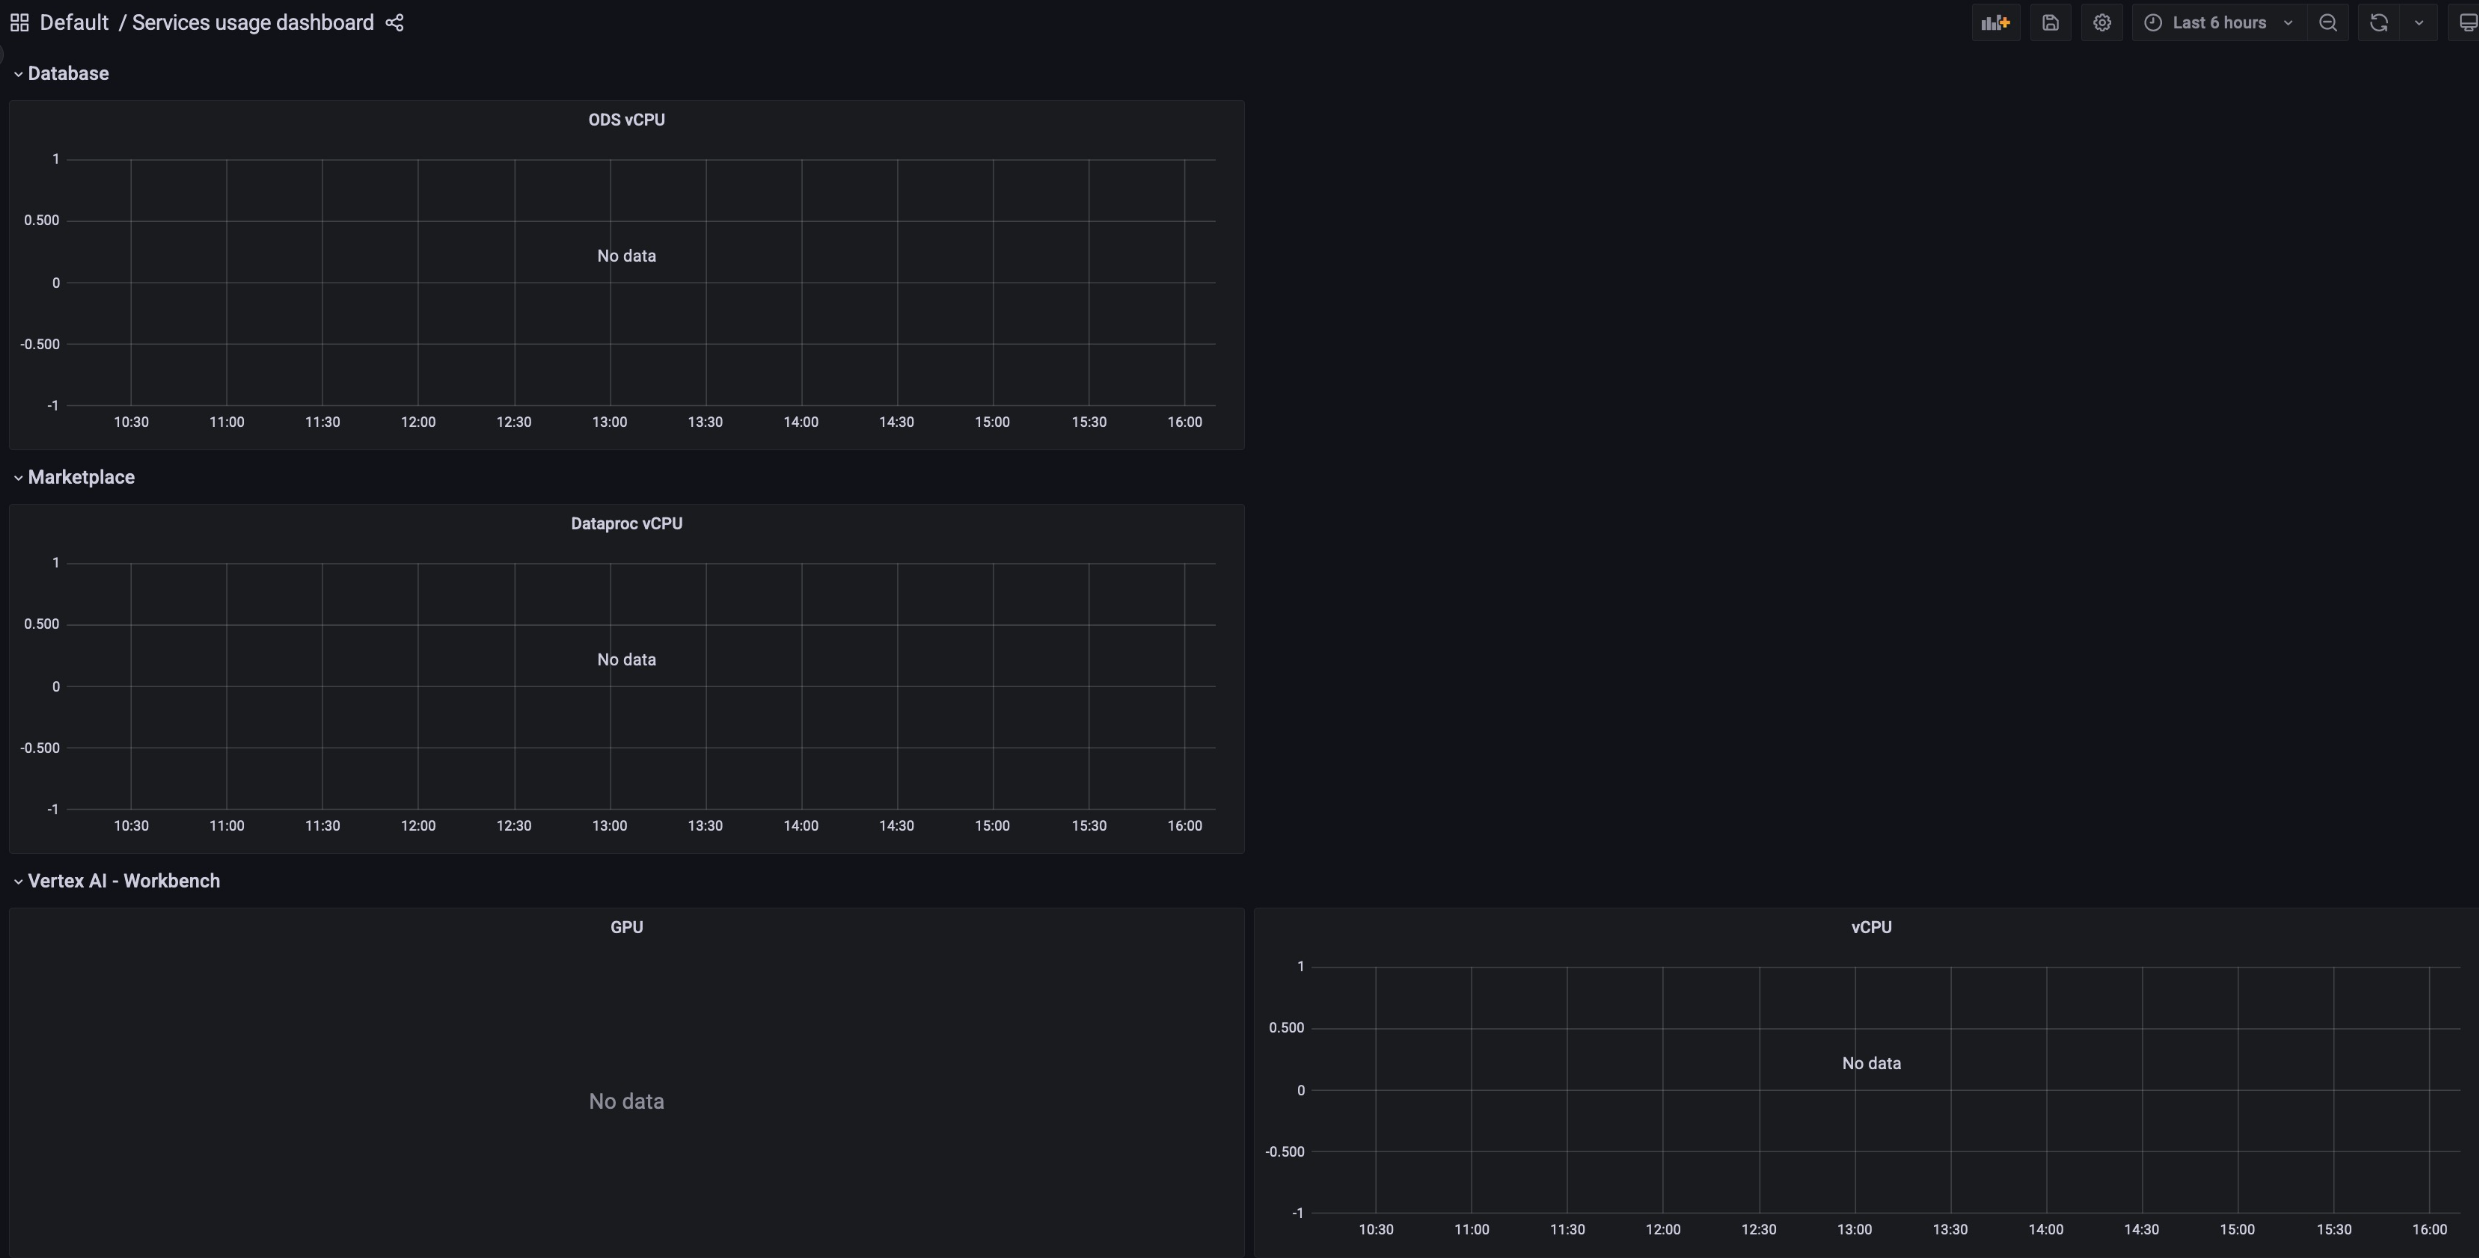
Alokasi Penyimpanan: melacak jumlah penggunaan resource yang telah digunakan oleh layanan tertentu dalam project Anda. Layanan mencakup resource seperti Backup, Marketplace, Database Service, dan Vertex AI.
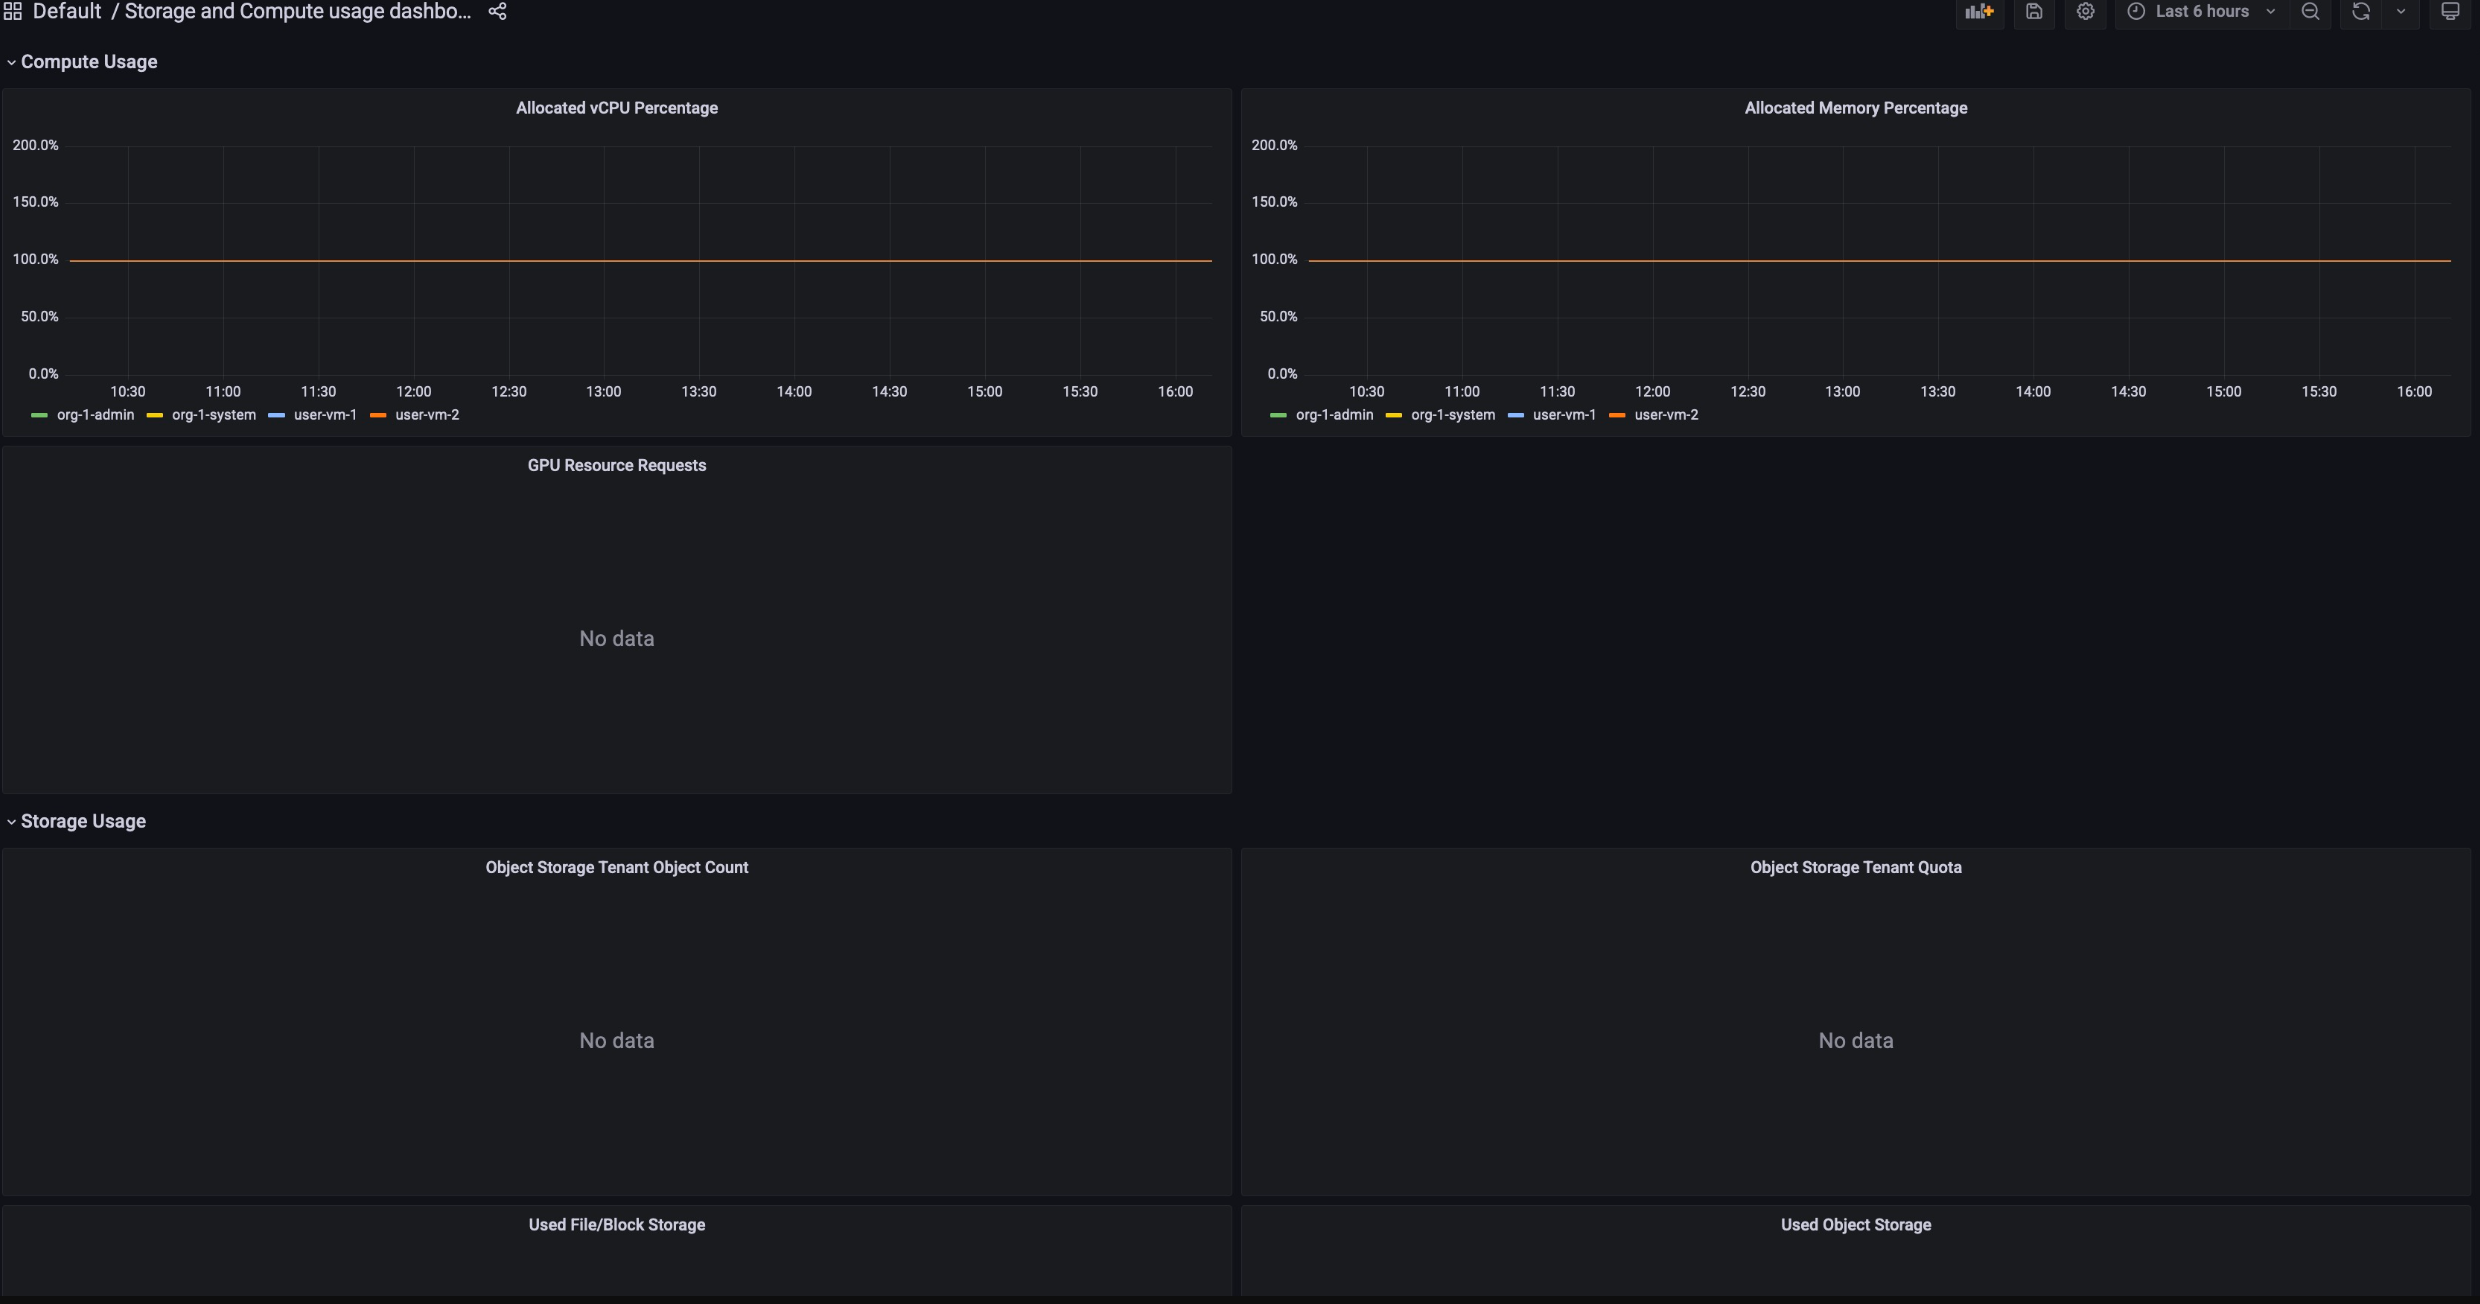
Alokasi Komputasi: melacak metrik penggunaan resource pada layanan Penyimpanan dan Komputasi untuk jangka waktu tertentu. Dasbor ini tersedia untuk tujuan pemantauan.
Untuk melihat dasbor Penggunaan Penagihan, ikuti langkah-langkah berikut:
Login ke konsol GDC.
Di menu navigasi, pilih Penagihan > Laporan.
Di halaman Laporan penagihan, pilih layanan yang ingin Anda lihat.
Misalnya, untuk melihat penggunaan metrik layanan terkelola, Vertex AI, klik GPU atau vCPU.
Untuk melihat jangka waktu tertentu di dasbor tertentu, klik drop-down
Waktu di menu. Drop-down Waktu secara default menampilkan
metrik enam jam terakhir.
[[["Mudah dipahami","easyToUnderstand","thumb-up"],["Memecahkan masalah saya","solvedMyProblem","thumb-up"],["Lainnya","otherUp","thumb-up"]],[["Sulit dipahami","hardToUnderstand","thumb-down"],["Informasi atau kode contoh salah","incorrectInformationOrSampleCode","thumb-down"],["Informasi/contoh yang saya butuhkan tidak ada","missingTheInformationSamplesINeed","thumb-down"],["Masalah terjemahan","translationIssue","thumb-down"],["Lainnya","otherDown","thumb-down"]],["Terakhir diperbarui pada 2025-09-04 UTC."],[[["\u003cp\u003eBilling reports dashboards allow you to track resource consumption over time for effective resource management.\u003c/p\u003e\n"],["\u003cp\u003eDashboards are available for both Storage Allocation and Compute Allocation, showing resource usage metrics for various services.\u003c/p\u003e\n"],["\u003cp\u003eTo view the dashboards, you must be granted the corresponding viewer role by your Organization IAM Admin.\u003c/p\u003e\n"],["\u003cp\u003eYou can view resource usage for specific services, such as Vertex AI, within the Billing reports page by selecting the desired service.\u003c/p\u003e\n"],["\u003cp\u003eThe dashboards display resource consumption metrics, which may not directly correspond to the final pricing shown on invoices.\u003c/p\u003e\n"]]],[],null,["# Track resource consumption\n\nView the consumption of each resource through the Billing reports dashboards.\nThese dashboards are available to track your resource consumption over a period\nof time, and help you manage your resources effectively.\n\nTo get the permissions you need to view the Billing Usage dashboards, ask\nyour Organization IAM Admin to grant you the corresponding viewer role for your\nproject.\n\nThe Billing Usage dashboards consist of the following:\n\n- **Storage Allocation**: tracks how much resource usage a given service in your\n project has consumed. Services include resources such as Backup,\n Marketplace, Database Service, and Vertex AI.\n\n | **Important:** Metrics in the Services Usage dashboard is not a direct mapping to the price you might see in the Invoice dashboard. For example, the quantity of consumption you see in the Services Usage dashboard might not match the quantity GDC used to calculate the price in the Invoice dashboard.\n- **Compute Allocation**: tracks the metrics of resource usage on\n Storage and Compute services for a given period of time. This dashboard is\n available for monitoring purposes.\n\nTo view the Billing Usage dashboards, work through the following steps:\n\n1. Sign in to the GDC console.\n2. In the navigation menu, select **Billing \\\u003e Reports**.\n3. In the **Billing reports** page, select the service that you want to view. For example, to view the metric consumption of the managed service, Vertex AI, click either `GPU` or `vCPU`.\n4. To view a certain period of time in a given dashboard, click the **Time** drop-down in the menu bar. The **Time** drop-down defaults to show the metrics of the last six hours."]]