Mantieni tutto organizzato con le raccolte
Salva e classifica i contenuti in base alle tue preferenze.
La dashboard delle metriche a livello di VM fornisce grafici per la visualizzazione di metriche specifiche
delle VM per i tuoi progetti. Accedi alla dashboard da questo indirizzo:
Questi tipi di grafici vengono generati utilizzando le metriche di monitoraggio delle VM. Le metriche sono
denominate e descritte in base al tipo, alle etichette e ai significati.
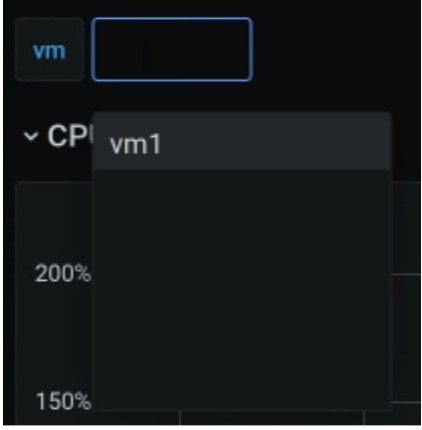
Nella visualizzazione della dashboard, dalla casella di selezione all'inizio della pagina, contrassegnata come "vm" nell'immagine seguente, scegli la VM che vuoi osservare. L'immagine
mostra che è stata selezionata la VM1.
CPU
Visualizza l'utilizzo della CPU, ovvero la quantità di tempo che ogni vCPU trascorre in
stati diversi. Il grafico mostra le informazioni per ciascuna delle vCPU specificate
dal tipo di macchina.
Memoria
Dal grafico della memoria, visualizza attributi come la memoria totale allocata alla VM,
la quantità di memoria disponibile e la quantità di memoria utilizzata.
Rete
Utilizza la pagina Rete per visualizzare quanto segue:
Il numero di pacchetti ricevuti dalla rete e inviati alla rete.
La quantità di byte ricevuti dalla rete e inviati alla rete.
Il numero di pacchetti di ricezione e trasmissione eliminati sulle interfacce
della scheda di interfaccia di rete virtuale (vNIC).
Il conteggio dei pacchetti di errore di trasmissione di rete.
Disco
Visualizza la pagina Disco per vedere quanto segue:
Un conteggio dei byte per le letture o le scritture su un disco
Conteggio delle operazioni di I/O di scrittura o lettura.
Il tempo cumulativo impiegato per un'operazione di lettura o scrittura:
Il tempo in cui l'operazione è in coda
Il tempo trascorso per l'esecuzione effettiva dell'operazione (disco occupato)
Numeri delle richieste di svuotamento del disco e tempo dedicato allo svuotamento della cache.
[[["Facile da capire","easyToUnderstand","thumb-up"],["Il problema è stato risolto","solvedMyProblem","thumb-up"],["Altra","otherUp","thumb-up"]],[["Difficile da capire","hardToUnderstand","thumb-down"],["Informazioni o codice di esempio errati","incorrectInformationOrSampleCode","thumb-down"],["Mancano le informazioni o gli esempi di cui ho bisogno","missingTheInformationSamplesINeed","thumb-down"],["Problema di traduzione","translationIssue","thumb-down"],["Altra","otherDown","thumb-down"]],["Ultimo aggiornamento 2025-09-04 UTC."],[[["\u003cp\u003eThe VM-level metrics dashboard provides graphs for viewing VM-specific metrics for projects, accessible via a specific URL that requires replacing placeholders with organization and project details.\u003c/p\u003e\n"],["\u003cp\u003eThe dashboard includes graphs for CPU, memory, network, and disk usage for each VM in project namespaces, generated using VM monitoring metrics.\u003c/p\u003e\n"],["\u003cp\u003eUsers can select a specific VM from a selection box within the dashboard to view detailed information, like CPU utilization, memory allocation and usage, network packet statistics, and disk read/write operations.\u003c/p\u003e\n"],["\u003cp\u003eThe network graph provides details on received and sent packets, byte counts, dropped packets, and network transmit errors.\u003c/p\u003e\n"],["\u003cp\u003eThe disk graph allows users to view bytes read and written, read/write operation counts and times, as well as disk flush numbers and time.\u003c/p\u003e\n"]]],[],null,["# Monitor VM metrics\n\nThe VM-level metrics dashboard provides you with graphs for viewing VM-specific\nmetrics for your projects. Access the dashboard from this address:\n\n`https://`\u003cvar translate=\"no\"\u003eGDC_URL\u003c/var\u003e`/`\u003cvar translate=\"no\"\u003ePROJECT\u003c/var\u003e`/grafana/d/h2Wx80n4k/workload-vms`\n\n- Replace \u003cvar translate=\"no\"\u003eGDC_URL\u003c/var\u003e with the URL of your organization in Google Distributed Cloud (GDC) air-gapped.\n- Replace \u003cvar translate=\"no\"\u003ePROJECT\u003c/var\u003e with the name of your project. The name of the project for platform administrators is `platform-obs`.\n\nThis page provides an overview of the VM dashboard and the type of information\nprovided by the different graphs accessible from it.\n\nVM dashboard\n------------\n\nThe VM dashboard presents graphs that contain information regarding the following\nfor each VM in each of your project namespaces:\n\n- [CPU](#cpu-graph)\n- [Memory](#memory-graph)\n- [Network](#network-graph)\n- [Disk](#disk-graph)\n\nThese graph types are generated using the VM monitoring metrics. The metrics are\nnamed and described according to their type, labels, and meanings.\n\nIn the dashboard view, from the selection box at the beginning of the page, which\nis marked in the following image as \"vm\", choose the VM you want to observe. The\nimage shows that vm1 was selected.\n\n\u003cbr /\u003e\n\nCPU\n---\n\nView the CPU utilization - the amount of time that each vCPU spends in\ndifferent states. The graph displays information for each of the vCPUs specified\nby your machine type.\n\nMemory\n------\n\nFrom the memory graph, view such attributes as the total memory allocated to the VM,\nthe amount of memory available, and the amount of memory being used.\n\nNetwork\n-------\n\nUse the Network page to view the following:\n\n- The number of packets received from and sent to the network.\n- The quantity of bytes received from and sent to the network.\n- The number of receive and transmit packets that have been dropped on virtual network interface card (vNIC) interfaces.\n- The network transmit error packet count.\n\nDisk\n----\n\nView the Disk page to see the following:\n\n- A bytes count for reads from or writes to a disk\n- A count of write or read IO operations.\n- The cumulative time taken for a read or write operation:\n - The time the operation is in queue\n - The time spent actually executing the operation (disk busy)\n- Disk flush request numbers, and the time spent on cache flushing.\n\nMetrics list\n------------\n\nTo see a list of the metrics definitions, view the list on the\n[Virtual Machine Management (VMM)](/distributed-cloud/hosted/docs/latest/gdch/platform-application/pa-ao-operations/metrics-vmm#metrics-list)\npage."]]