Substitua GDC_URL pelo URL da sua organização no
Google Distributed Cloud (GDC) isolado por air-gap.
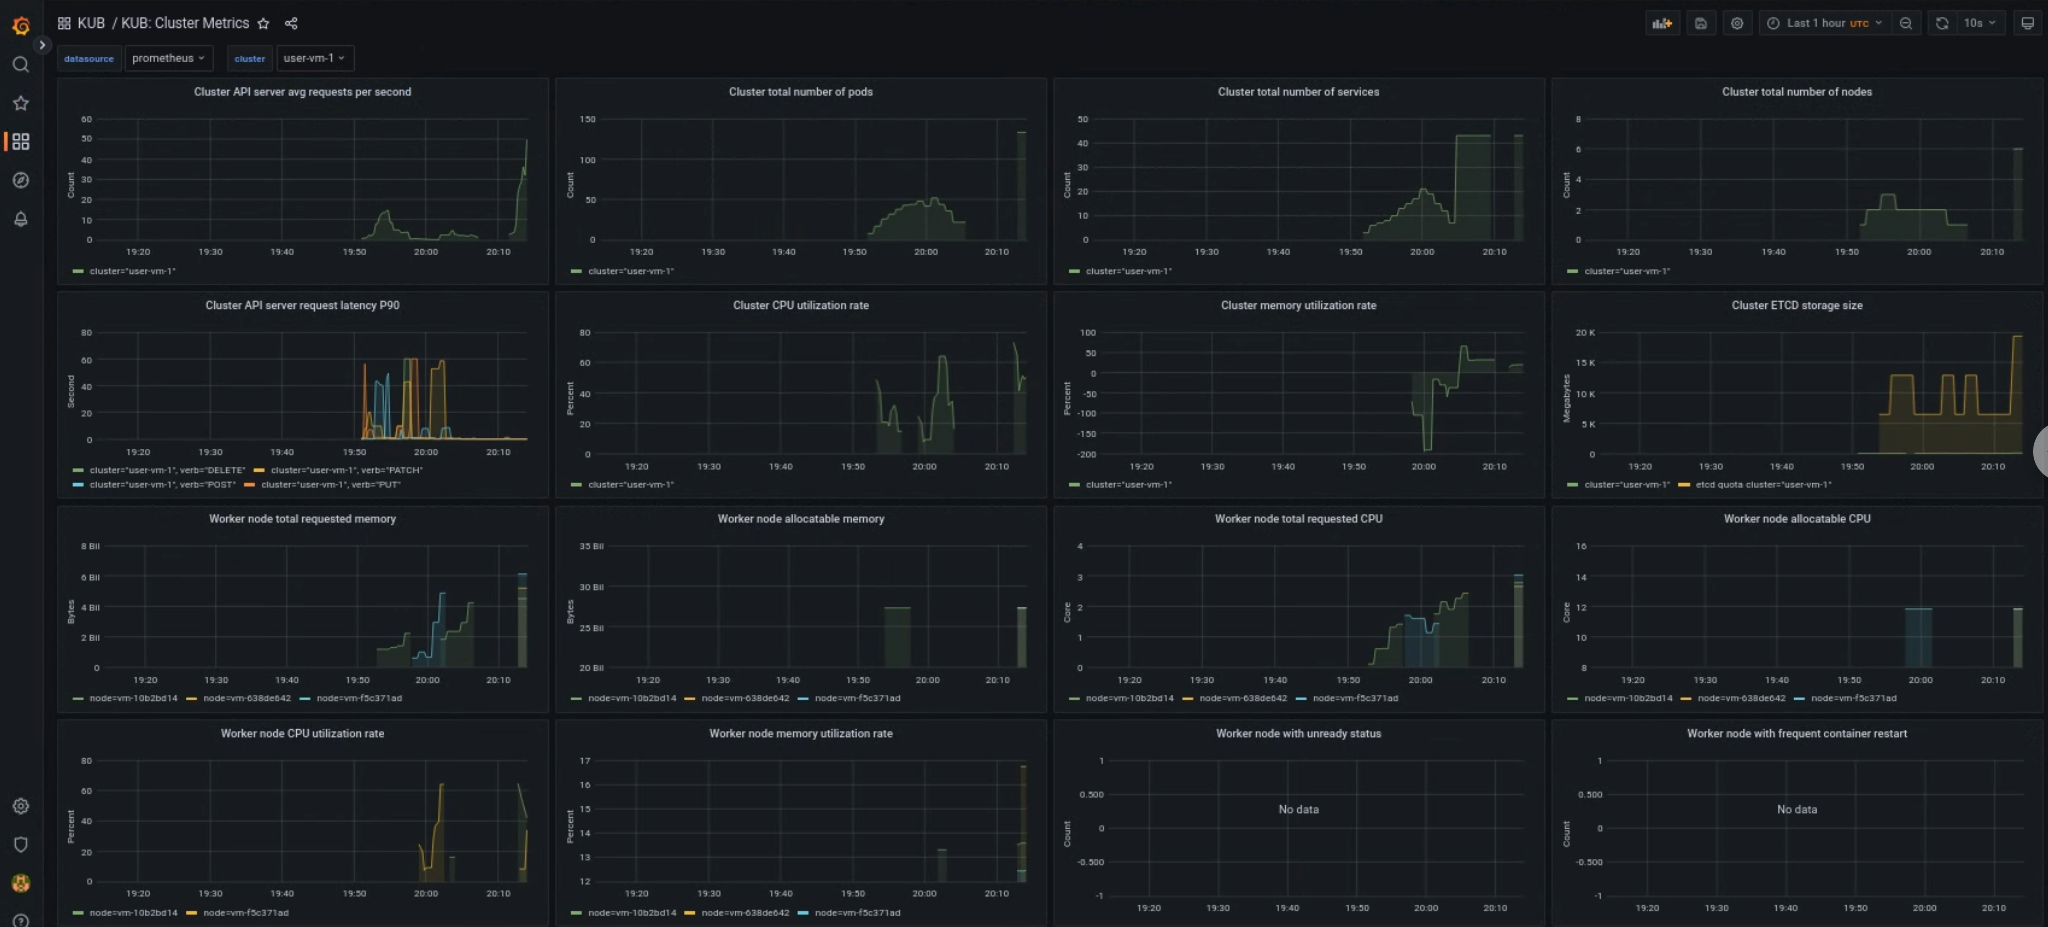
Painel de clusters de usuário do KUB
O painel do KUB apresenta gráficos e painéis de visualização com informações sobre a integridade do cluster de usuário no namespace do projeto.
É possível conferir a integridade geral dos clusters de usuários para resolver problemas e identificar possíveis restrições de recursos no nível do cluster.
Integridade geral do cluster de usuário
Neste painel, você pode ter insights valiosos sobre a integridade do cluster do Kubernetes, como:
[[["Fácil de entender","easyToUnderstand","thumb-up"],["Meu problema foi resolvido","solvedMyProblem","thumb-up"],["Outro","otherUp","thumb-up"]],[["Difícil de entender","hardToUnderstand","thumb-down"],["Informações incorretas ou exemplo de código","incorrectInformationOrSampleCode","thumb-down"],["Não contém as informações/amostras de que eu preciso","missingTheInformationSamplesINeed","thumb-down"],["Problema na tradução","translationIssue","thumb-down"],["Outro","otherDown","thumb-down"]],["Última atualização 2025-09-04 UTC."],[[["\u003cp\u003eThe KUB component's metrics dashboard offers visual panels for monitoring user cluster health.\u003c/p\u003e\n"],["\u003cp\u003eAccess the user cluster health dashboard via the provided URL, replacing \u003ccode\u003e<var translate="no">GDC_URL</var>\u003c/code\u003e with your organization's URL.\u003c/p\u003e\n"],["\u003cp\u003eThe dashboard provides data regarding general user cluster health for troubleshooting and identifying potential resource constraints.\u003c/p\u003e\n"],["\u003cp\u003eInsights on API server traffic, latency, cluster CPU and memory usage, and node conditions are available on this user cluster dashboard.\u003c/p\u003e\n"]]],[],null,["# Monitor Kubernetes cluster health metrics\n\nThe metrics dashboard of the KUB component provides graphical information and\nvisualization panels for viewing user cluster health.\n\nOpen the following URL to access the user cluster health dashboard: \n\n https://\u003cvar translate=\"no\"\u003eGDC_URL\u003c/var\u003e/platform-obs/grafana/KUB-pa-cluster-metrics\n\nReplace \u003cvar translate=\"no\"\u003eGDC_URL\u003c/var\u003e with the URL of your organization in\nGoogle Distributed Cloud (GDC) air-gapped.\n\nKUB user cluster dashboard\n--------------------------\n\nThe KUB dashboard presents graphs and visualization panels that contain\ninformation about user cluster health in your project namespace.\n\nYou can view the general health of user clusters to troubleshoot issues and to\nidentify potential resource constraints at the cluster level.\n\n### User cluster general health\n\nIn this dashboard, you can gain valuable insights for your Kubernetes cluster\nhealth, such as the following:\n\n- API server traffic and latency\n- Cluster CPU and memory usage\n- Node conditions"]]