Monitorare le metriche sullo stato del cluster Kubernetes
Mantieni tutto organizzato con le raccolte
Salva e classifica i contenuti in base alle tue preferenze.
La dashboard delle metriche del componente KUB fornisce informazioni grafiche e
pannelli di visualizzazione per monitorare l'integrità del cluster utente.
Apri il seguente URL per accedere alla dashboard sullo stato del cluster utente:
Sostituisci GDC_URL con l'URL della tua organizzazione in
Google Distributed Cloud (GDC) air-gapped.
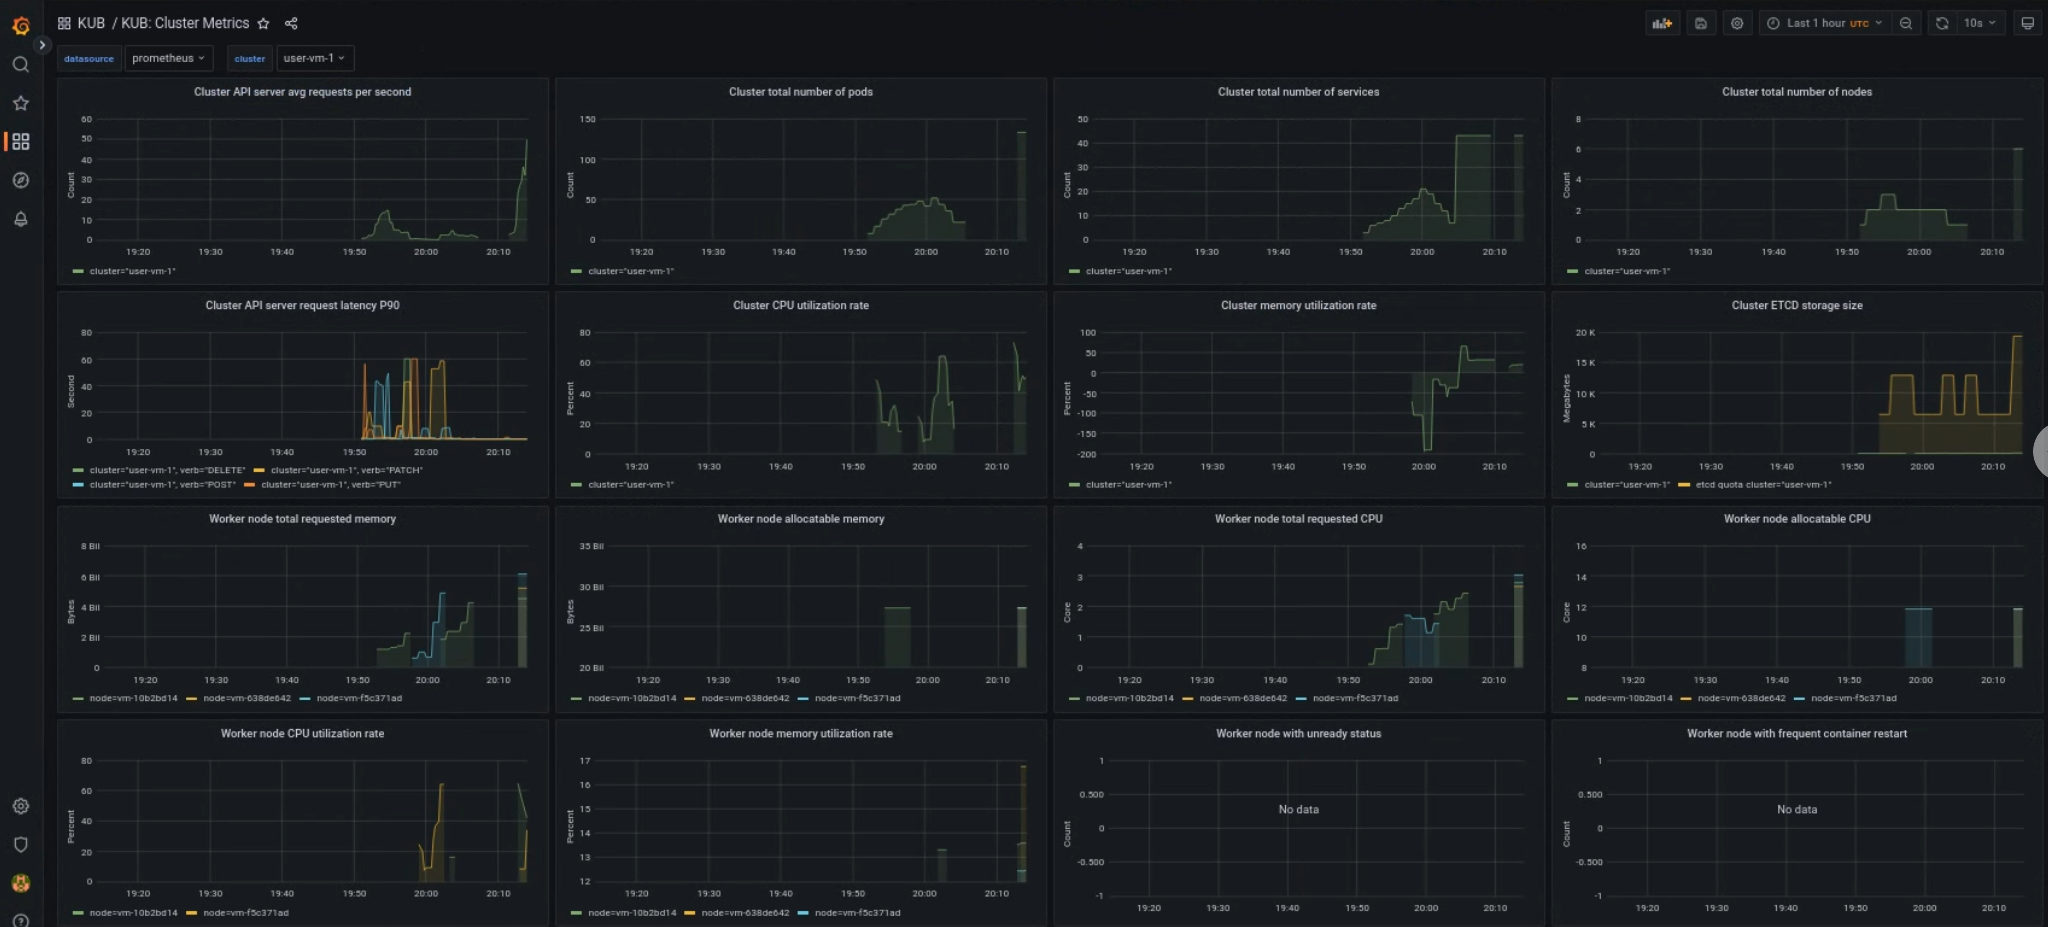
Dashboard del cluster utente KUB
La dashboard KUB mostra grafici e riquadri di visualizzazione che contengono
informazioni sullo stato del cluster utente nello spazio dei nomi del progetto.
Puoi visualizzare lo stato generale dei cluster utente per risolvere i problemi e
identificare potenziali limiti delle risorse a livello di cluster.
Integrità generale del cluster utente
In questa dashboard puoi ottenere informazioni preziose sullo stato del tuo cluster Kubernetes, ad esempio:
[[["Facile da capire","easyToUnderstand","thumb-up"],["Il problema è stato risolto","solvedMyProblem","thumb-up"],["Altra","otherUp","thumb-up"]],[["Difficile da capire","hardToUnderstand","thumb-down"],["Informazioni o codice di esempio errati","incorrectInformationOrSampleCode","thumb-down"],["Mancano le informazioni o gli esempi di cui ho bisogno","missingTheInformationSamplesINeed","thumb-down"],["Problema di traduzione","translationIssue","thumb-down"],["Altra","otherDown","thumb-down"]],["Ultimo aggiornamento 2025-09-04 UTC."],[[["\u003cp\u003eThe KUB component's metrics dashboard offers visual panels for monitoring user cluster health.\u003c/p\u003e\n"],["\u003cp\u003eAccess the user cluster health dashboard via the provided URL, replacing \u003ccode\u003e<var translate="no">GDC_URL</var>\u003c/code\u003e with your organization's URL.\u003c/p\u003e\n"],["\u003cp\u003eThe dashboard provides data regarding general user cluster health for troubleshooting and identifying potential resource constraints.\u003c/p\u003e\n"],["\u003cp\u003eInsights on API server traffic, latency, cluster CPU and memory usage, and node conditions are available on this user cluster dashboard.\u003c/p\u003e\n"]]],[],null,["# Monitor Kubernetes cluster health metrics\n\nThe metrics dashboard of the KUB component provides graphical information and\nvisualization panels for viewing user cluster health.\n\nOpen the following URL to access the user cluster health dashboard: \n\n https://\u003cvar translate=\"no\"\u003eGDC_URL\u003c/var\u003e/platform-obs/grafana/KUB-pa-cluster-metrics\n\nReplace \u003cvar translate=\"no\"\u003eGDC_URL\u003c/var\u003e with the URL of your organization in\nGoogle Distributed Cloud (GDC) air-gapped.\n\nKUB user cluster dashboard\n--------------------------\n\nThe KUB dashboard presents graphs and visualization panels that contain\ninformation about user cluster health in your project namespace.\n\nYou can view the general health of user clusters to troubleshoot issues and to\nidentify potential resource constraints at the cluster level.\n\n### User cluster general health\n\nIn this dashboard, you can gain valuable insights for your Kubernetes cluster\nhealth, such as the following:\n\n- API server traffic and latency\n- Cluster CPU and memory usage\n- Node conditions"]]