Reemplaza GDC_URL por la URL de tu organización en Google Distributed Cloud (GDC) aislado.
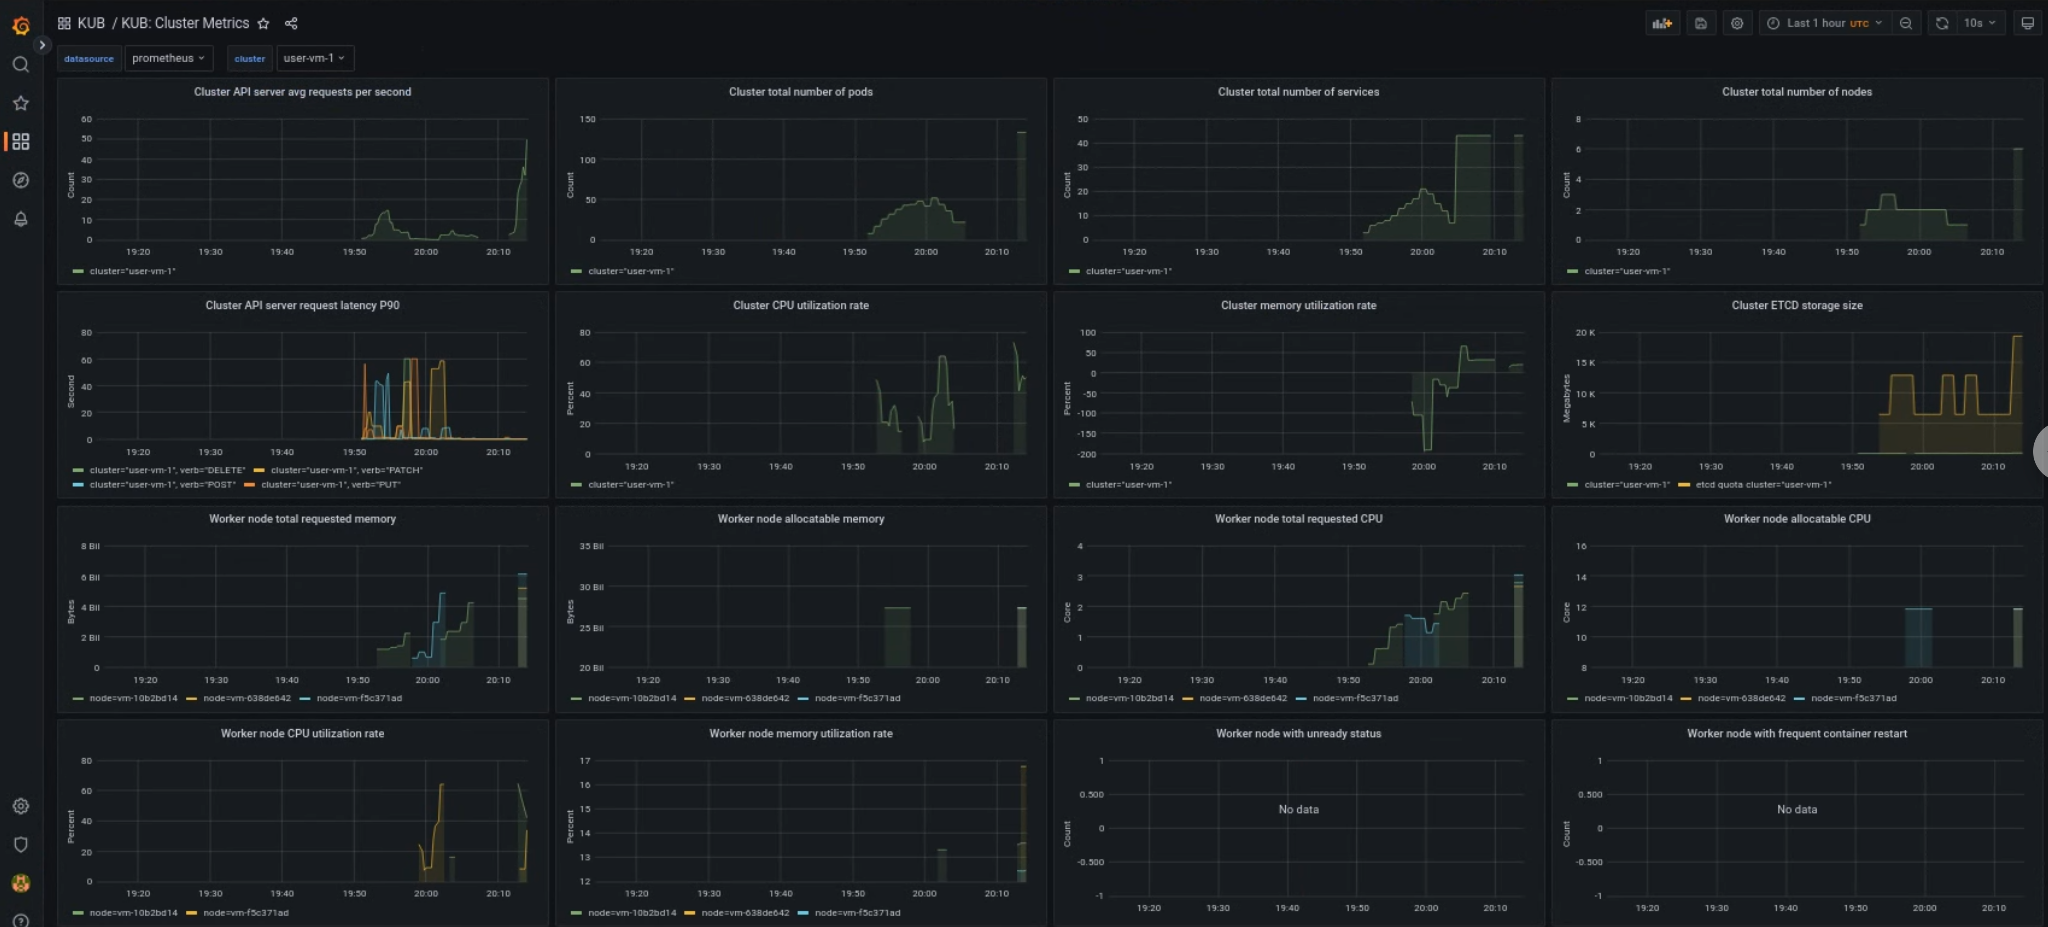
Panel del clúster de usuario de KUB
El panel de KUB presenta gráficos y paneles de visualización que contienen información sobre el estado del clúster de usuario en el espacio de nombres de tu proyecto.
Puedes ver el estado general de los clústeres de usuarios para solucionar problemas y detectar posibles limitaciones de recursos a nivel del clúster.
Estado general del clúster de usuario
En este panel, puedes obtener estadísticas valiosas sobre el estado de tu clúster de Kubernetes, como las siguientes:
[[["Fácil de comprender","easyToUnderstand","thumb-up"],["Resolvió mi problema","solvedMyProblem","thumb-up"],["Otro","otherUp","thumb-up"]],[["Difícil de entender","hardToUnderstand","thumb-down"],["Información o código de muestra incorrectos","incorrectInformationOrSampleCode","thumb-down"],["Faltan la información o los ejemplos que necesito","missingTheInformationSamplesINeed","thumb-down"],["Problema de traducción","translationIssue","thumb-down"],["Otro","otherDown","thumb-down"]],["Última actualización: 2025-09-04 (UTC)"],[[["\u003cp\u003eThe KUB component's metrics dashboard offers visual panels for monitoring user cluster health.\u003c/p\u003e\n"],["\u003cp\u003eAccess the user cluster health dashboard via the provided URL, replacing \u003ccode\u003e<var translate="no">GDC_URL</var>\u003c/code\u003e with your organization's URL.\u003c/p\u003e\n"],["\u003cp\u003eThe dashboard provides data regarding general user cluster health for troubleshooting and identifying potential resource constraints.\u003c/p\u003e\n"],["\u003cp\u003eInsights on API server traffic, latency, cluster CPU and memory usage, and node conditions are available on this user cluster dashboard.\u003c/p\u003e\n"]]],[],null,["# Monitor Kubernetes cluster health metrics\n\nThe metrics dashboard of the KUB component provides graphical information and\nvisualization panels for viewing user cluster health.\n\nOpen the following URL to access the user cluster health dashboard: \n\n https://\u003cvar translate=\"no\"\u003eGDC_URL\u003c/var\u003e/platform-obs/grafana/KUB-pa-cluster-metrics\n\nReplace \u003cvar translate=\"no\"\u003eGDC_URL\u003c/var\u003e with the URL of your organization in\nGoogle Distributed Cloud (GDC) air-gapped.\n\nKUB user cluster dashboard\n--------------------------\n\nThe KUB dashboard presents graphs and visualization panels that contain\ninformation about user cluster health in your project namespace.\n\nYou can view the general health of user clusters to troubleshoot issues and to\nidentify potential resource constraints at the cluster level.\n\n### User cluster general health\n\nIn this dashboard, you can gain valuable insights for your Kubernetes cluster\nhealth, such as the following:\n\n- API server traffic and latency\n- Cluster CPU and memory usage\n- Node conditions"]]