Tetap teratur dengan koleksi
Simpan dan kategorikan konten berdasarkan preferensi Anda.
Dasbor metrik komponen Managed Harbor Service (MHS) menyediakan grafik dan panel visualisasi untuk melihat konsumsi penyimpanan dan jumlah pemindaian kerentanan yang dilakukan.
Buka URL berikut untuk mengakses dasbor kesehatan cluster pengguna:
GDC_URL: URL organisasi Anda di
Google Distributed Cloud (GDC) yang terisolasi.
ORG_ID: ID organisasi Anda di GDC.
Melihat dasbor metrik MHS
Di dasbor ini, Anda bisa mendapatkan insight berharga untuk instance Harbor, seperti berikut:
Jumlah pemindaian kerentanan Harbor yang dilakukan.
Jumlah kapasitas penyimpanan objek yang digunakan.
Jumlah project Harbor.
Gunakan panel Pemindaian Kerentanan Harbor untuk melihat jumlah pemindaian kerentanan yang Anda lakukan untuk instance Harbor Anda.
Gunakan panel Kapasitas yang Digunakan Object Storage untuk melihat metrik penggunaan penyimpanan dan mengukur jumlah resource penyimpanan objek yang Anda gunakan.
Gunakan panel Harbor Projects untuk melihat jumlah semua project Harbor di instance Harbor.
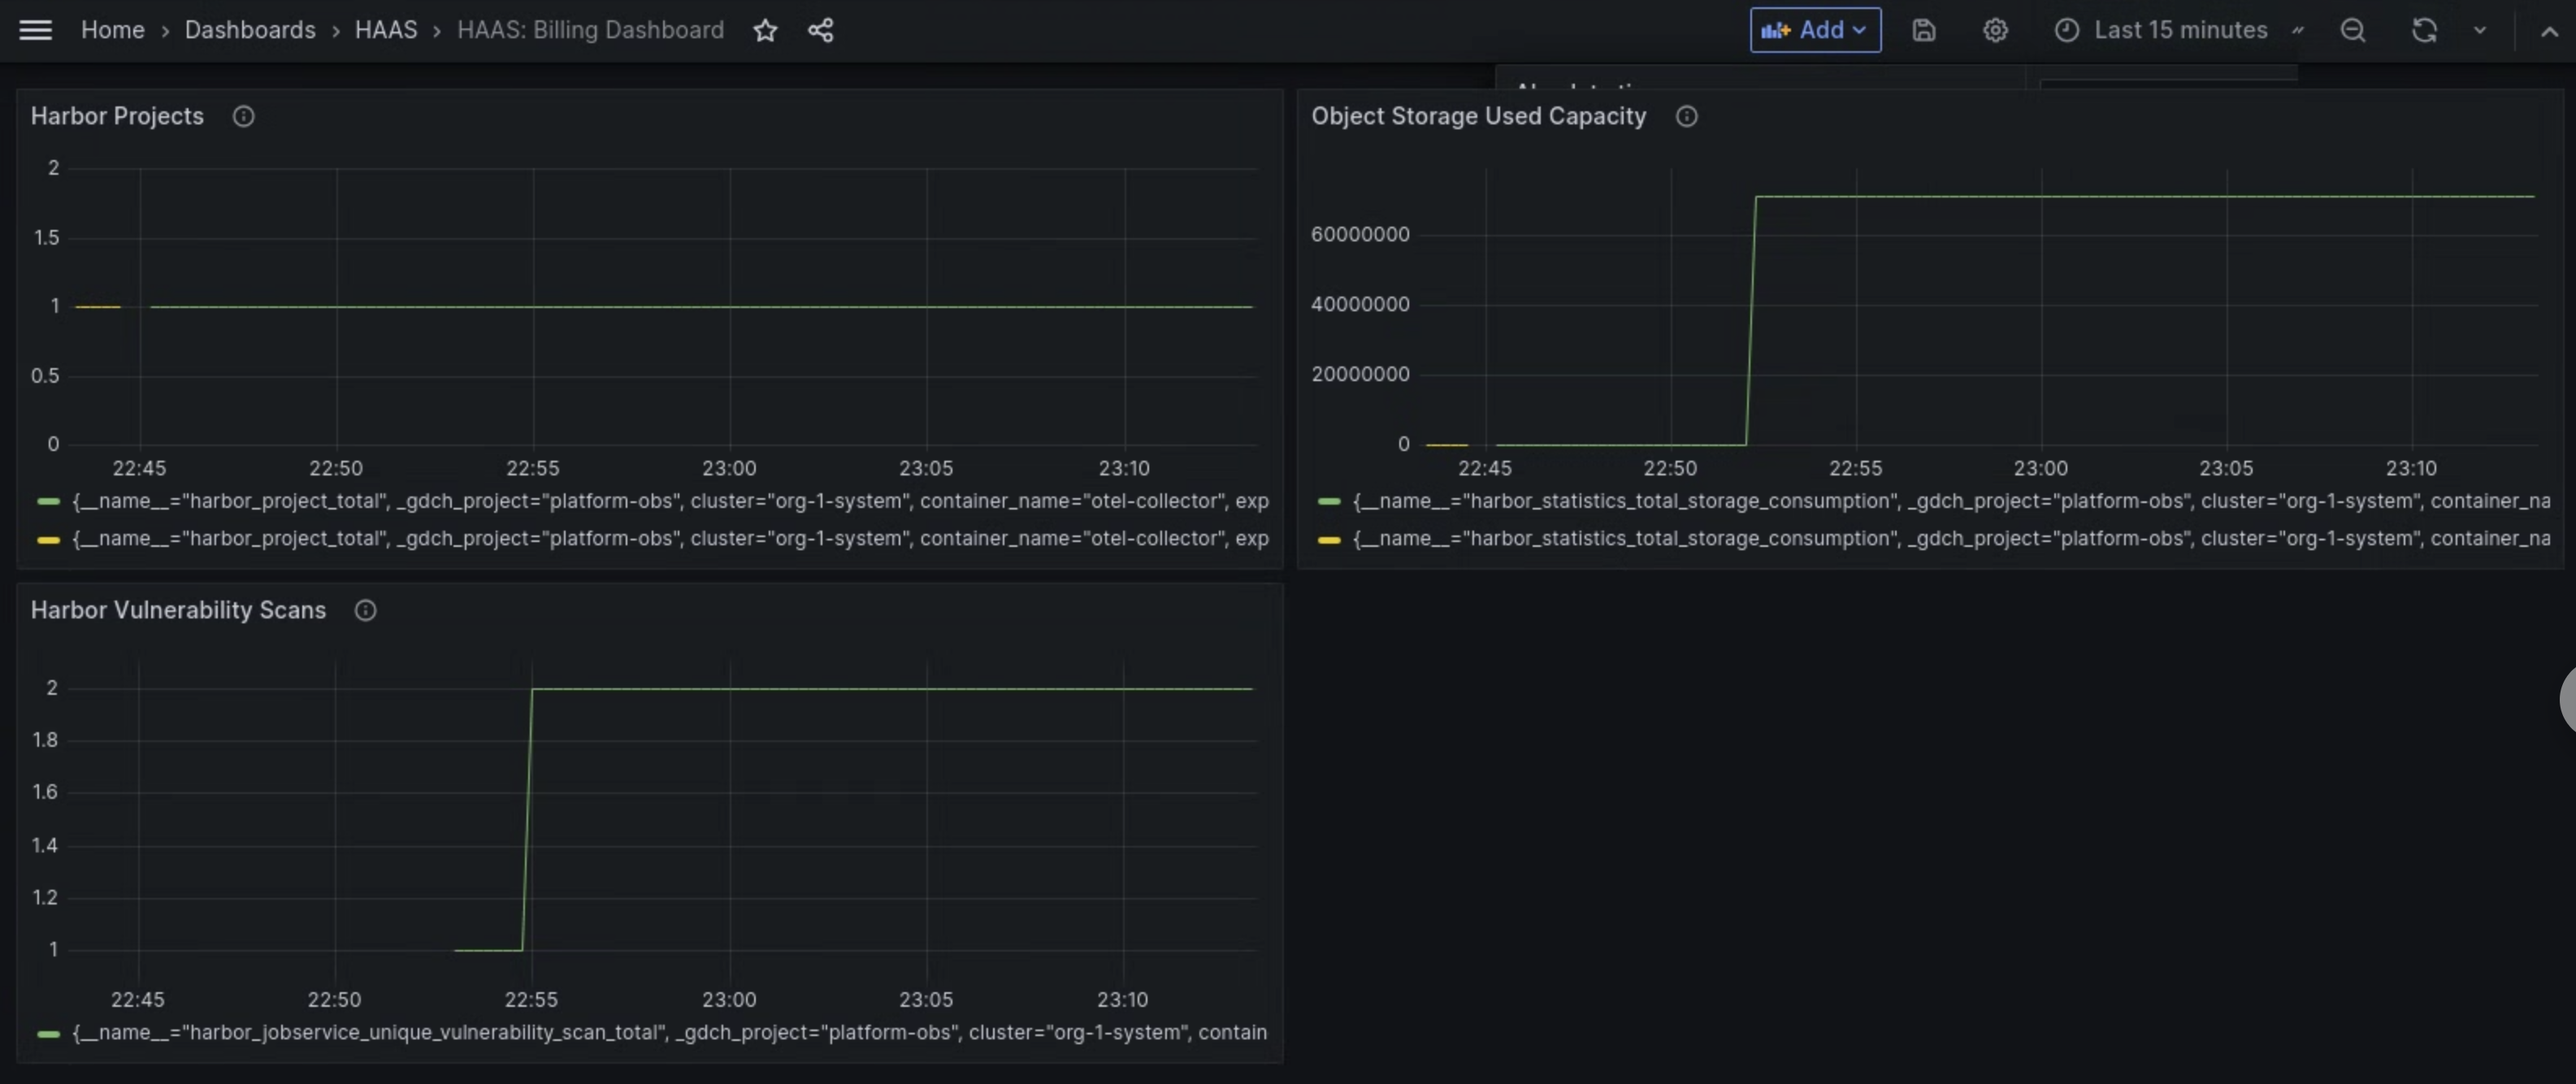
Gambar 1. Gunakan dasbor MHS di Grafana untuk melihat metrik pemindaian kerentanan Harbor, konsumsi penyimpanan, dan jumlah project.
[[["Mudah dipahami","easyToUnderstand","thumb-up"],["Memecahkan masalah saya","solvedMyProblem","thumb-up"],["Lainnya","otherUp","thumb-up"]],[["Sulit dipahami","hardToUnderstand","thumb-down"],["Informasi atau kode contoh salah","incorrectInformationOrSampleCode","thumb-down"],["Informasi/contoh yang saya butuhkan tidak ada","missingTheInformationSamplesINeed","thumb-down"],["Masalah terjemahan","translationIssue","thumb-down"],["Lainnya","otherDown","thumb-down"]],["Terakhir diperbarui pada 2025-09-04 UTC."],[[["\u003cp\u003eThe Managed Harbor Service (MHS) metrics dashboard provides visualizations for storage consumption and vulnerability scan counts.\u003c/p\u003e\n"],["\u003cp\u003eYou can access the MHS dashboard via a specific URL, replacing placeholders for your organization's URL and ID.\u003c/p\u003e\n"],["\u003cp\u003eThe dashboard displays the number of Harbor vulnerability scans, the amount of object storage capacity used, and the number of Harbor projects.\u003c/p\u003e\n"],["\u003cp\u003ePanels are provided for harbor vulnerability scans, object storage used capacity and a view of total Harbor Projects.\u003c/p\u003e\n"]]],[],null,["# Monitor Harbor metrics\n\nThe metrics dashboard of the Managed Harbor Service (MHS) component provides graphs and visualization panels for\nviewing storage consumption and the number of vulnerability scans performed.\n\nOpen the following URL to access the user cluster health dashboard: \n\n https://\u003cvar translate=\"no\"\u003eGDC_URL\u003c/var\u003e/platform-obs/grafana/d/haas-billing/haas-billing-dashboard?orgId=\u003cvar translate=\"no\"\u003eORG_ID\u003c/var\u003e\n\nReplace the following:\n\n- \u003cvar translate=\"no\"\u003eGDC_URL\u003c/var\u003e: the URL of your organization in Google Distributed Cloud (GDC) air-gapped.\n- \u003cvar translate=\"no\"\u003eORG_ID\u003c/var\u003e: the ID for your organization in GDC.\n\nView the MHS metrics dashboard\n------------------------------\n\nIn this dashboard, you can gain valuable insights for your Harbor instances, such as the following:\n\n- The number of Harbor vulnerability scans performed.\n- The amount of object storage capacity used.\n- The number of Harbor projects.\n\nUse the **Harbor Vulnerability Scans** panel to view the number of vulnerability scans you are performing for your Harbor instances.\n\nUse the **Object Storage Used Capacity** panel to view storage consumption metrics and measure the amount of object storage resources you are using.\n\nUse the **Harbor Projects** panel to view the count of all Harbor projects in the Harbor instance.\n\n**Figure 1.** Use the MHS dashboard in Grafana to view metrics for Harbor vulnerability scans, storage consumption, and project counts."]]