로그와 측정항목을 사용하면 서비스를 모니터링하고 서비스 성능 문제를 해결할 수 있습니다. Google Distributed Cloud (GDC) 에어 갭의 모니터링 및 로깅 리소스를 사용하여 Vertex AI 서비스의 로그와 측정항목을 볼 수 있습니다. 특정 Vertex AI 측정항목을 모니터링하는 쿼리를 만들 수도 있습니다.
이 페이지에서는 모니터링 인스턴스라고도 하는 Distributed Cloud의 모니터링 인스턴스
이 페이지에는 광학 문자 인식 (OCR), Speech-to-Text, Vertex AI Translation과 같은 Vertex AI 플랫폼 및 서비스를 모니터링하는 데 사용할 수 있는 샘플 쿼리도 포함되어 있습니다. Distributed Cloud의 로깅 및 모니터링 솔루션에 대한 자세한 내용은 측정항목 및 로그 모니터링을 참고하세요.
시작하기 전에
Vertex AI의 로그 및 측정항목을 보는 데 필요한 권한을 얻으려면 프로젝트 IAM 관리자에게 프로젝트 네임스페이스에서 프로젝트 Grafana 뷰어 (project-grafana-viewer) 역할을 부여해 달라고 요청하세요.
이 역할에 대한 자세한 내용은 IAM 권한 준비를 참고하세요.
대시보드에서 로그 및 측정항목 시각화
대시보드에서 Vertex AI 측정항목과 로그를 볼 수 있습니다. 예를 들어 Vertex AI가 CPU 사용량에 미치는 영향을 확인하는 쿼리를 만들 수 있습니다.
다음 단계에 따라 대시보드에서 Vertex AI 로그와 측정항목을 확인하세요.
탐색 메뉴에서 Vertex AI > 사전 학습된 API를 클릭합니다.
사전 학습된 API 페이지에서 모니터링하려는 서비스의 Vertex AI API가 사용 설정되어 있는지 확인합니다.
Grafana에서 서비스 모니터링을 클릭하여 Grafana 홈페이지를 엽니다.
홈페이지의 탐색 메뉴에서 탐색 Explore을 클릭하여 Explore 페이지를 엽니다.
Explore 페이지의 메뉴에서 다음 데이터 소스 중 하나를 선택합니다.
- 운영 로그: 운영 로그를 가져옵니다.
- 감사 로그: 감사 로그를 가져옵니다.
- Prometheus: 측정항목을 가져옵니다.
측정항목을 표시하려면 PromQL(Prometheus Query Language) 표현식을 사용하여 쿼리를 입력합니다.
로그를 표시하려면 LogQL (로그 쿼리 언어) 표현식을 사용하여 쿼리를 입력합니다.
페이지에 쿼리와 일치하는 측정항목 또는 로그가 표시됩니다.
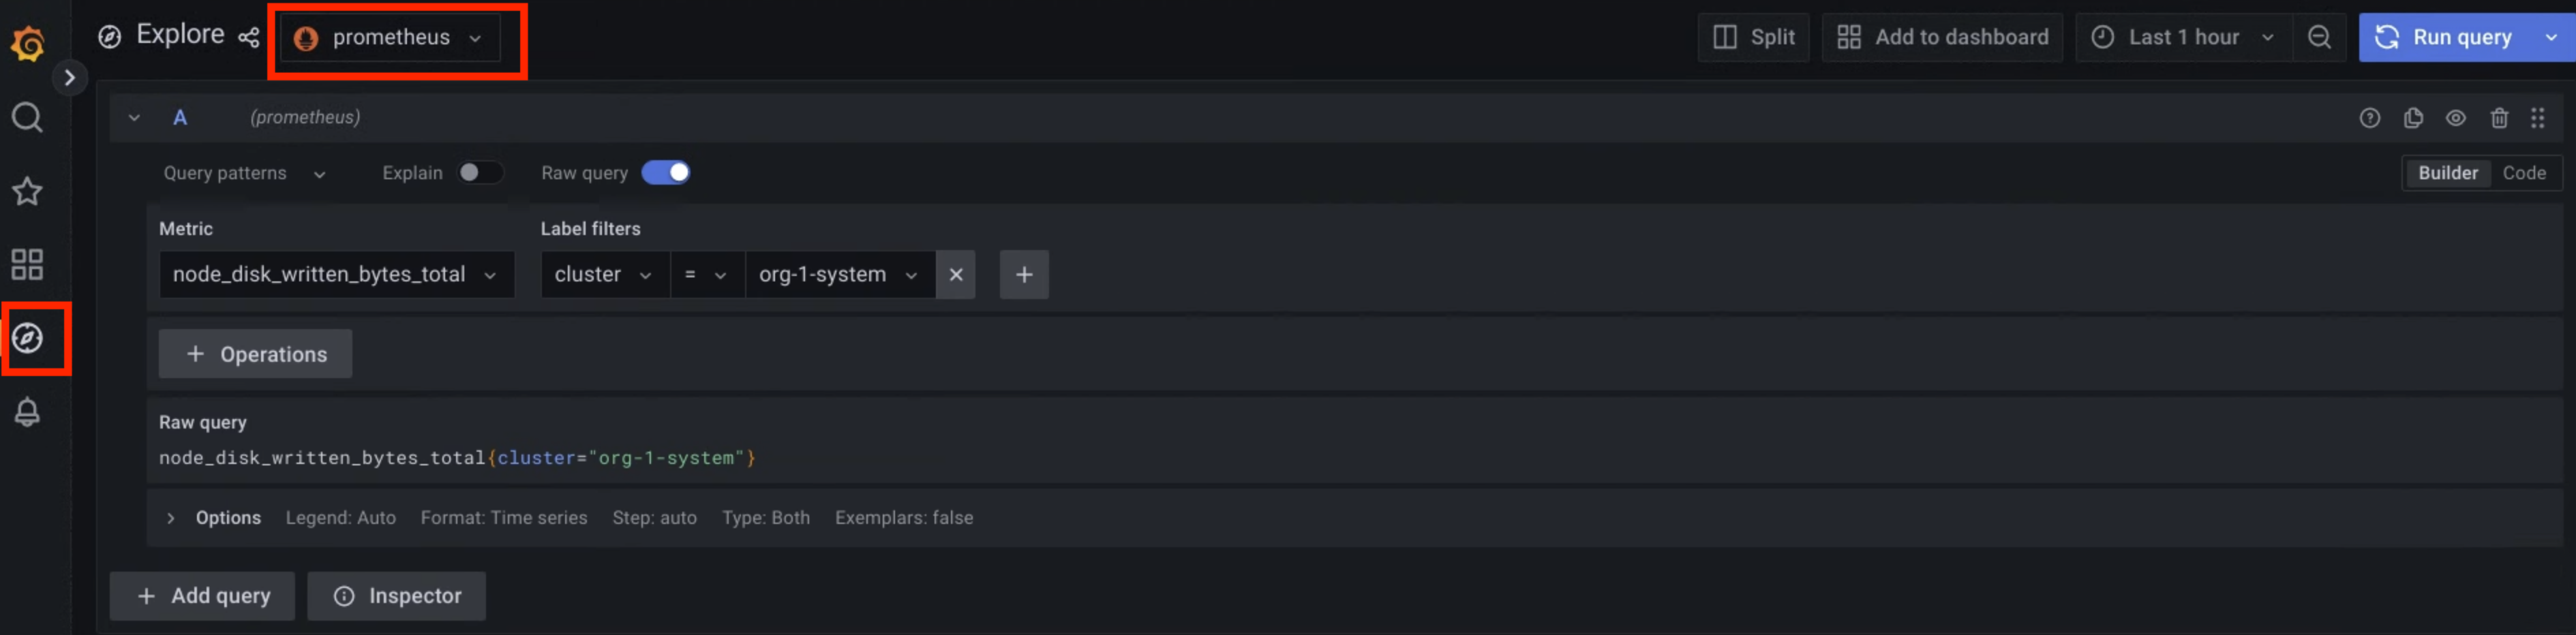
그림 1. 측정항목을 쿼리하는 Grafana의 메뉴 옵션
그림 1에서 Prometheus 옵션은 측정항목을 가져오는 쿼리를 빌드할 수 있는 인터페이스를 표시합니다.
샘플 쿼리
다음 표에는 환경에서 Vertex AI 플랫폼을 모니터링하기 위한 샘플 쿼리가 포함되어 있습니다.
| Vertex AI 플랫폼 | |||
|---|---|---|---|
| 데이터 소스 | 설명 | 구성요소 | 쿼리 |
| 측정항목 | 컨테이너의 CPU 사용량 비율 | 레벨 1 운영자 | rate(container_cpu_usage_seconds_total{namespace="ai-system",container="l1operator"}[30s]) * 100 |
| 레벨 2 상담사 | rate(container_cpu_usage_seconds_total{namespace="ai-system",container="l2operator"}[30s]) * 100 |
||
| 컨테이너의 메모리 사용량(MB) | 레벨 1 운영자 | container_memory_usage_bytes{namespace="ai-system",container="l1operator"} * 1e-6 |
|
| 레벨 2 상담사 | container_memory_usage_bytes{namespace="ai-system",container="l2operator"} * 1e-6 |
||
| 운영 로그 | L1 운영자 로그 | 레벨 1 운영자 | {service_name="vai-l1operator"} |
| L2 운영자 로그 | 레벨 2 상담사 | {service_name="vai-l2operator"} |
|
| 감사 로그 | 플랫폼 프런트엔드 감사 로그 | Vertex AI 웹 플러그인 프런트엔드 | {service_name="istio"} |~ upstream_cluster:.*(vai-web-plugin-frontend) |
| 플랫폼 백엔드 감사 로그 | Vertex AI 웹 플러그인 백엔드 | {service_name="istio"} |~ upstream_cluster:.*(vai-web-plugin-backend) |
|
다음 표에는 환경에서 OCR, Speech-to-Text, Vertex AI Translation과 같은 Vertex AI API 서비스를 모니터링하는 샘플 쿼리가 포함되어 있습니다.
| Vertex AI 서비스 | |||
|---|---|---|---|
| 데이터 소스 | 설명 | 서비스 | 쿼리 |
| 측정항목 | 사전 학습된 API가 CPU 사용량에 미치는 영향 |
OCR | rate(container_cpu_usage_seconds_total{namespace="g-vai-ocr-sie",container="CONTAINER_NAME"}[30s]) * 100 CONTAINER_NAME values: vision-extractor | vision-frontend | vision-vms-ocr |
| Speech-to-Text | rate(container_cpu_usage_seconds_total{namespace="g-vai-speech-sie",container="CONTAINER_NAME"}[30s]) * 100 |
||
| Vertex AI Translation | rate(container_cpu_usage_seconds_total{namespace="g-vai-translation-sie",container="CONTAINER_NAME"}[30s]) * 100 CONTAINER_NAME values: translation-aligner | translation-frontend | translation-prediction |
||
destination_service 필터 라벨을 사용하여 지난 60분 동안의 오류율을 가져옵니다. |
OCR | rate(istio_requests_total{destination_service=~".*g-vai-ocr-sie.svc.cluster.local",response_code=~"[4-5][0-9][0-9]"}[60m]) |
|
| Speech-to-Text | rate(istio_requests_total{destination_service=~".*g-vai-speech-sie.svc.cluster.local",response_code=~"[4-5][0-9][0-9]"}[60m]) |
||
| Vertex AI Translation | rate(istio_requests_total{destination_service=~".*g-vai-translation-sie.svc.cluster.local",response_code=~"[4-5][0-9][0-9]"}[60m]) |
||
| 운영 로그 | Vertex AI 서비스의 작업 로그 |
OCR | {namespace="g-vai-ocr-sie"} |
| Speech-to-Text | {namespace="g-vai-speech-sie"} |
||
| Vertex AI Translation | {namespace="g-vai-translation-sie"} |
||
| 감사 로그 | Vertex AI 서비스의 감사 로그 | OCR | {service_name="istio"} |= "vision-frontend-server" |
| Speech-to-Text | {service_name="istio"} |= "speech-frontend-server" |
||
| Vertex AI Translation | {service_name="istio"} |= "translation-frontend-server" |
||