本页面介绍了 Spanner 提供的存储利用率指标。
默认情况下,您的数据会存储在固态硬盘 (SSD) 存储空间中。您可以使用分层存储来选择是将数据存储在 SSD 还是硬盘驱动器 (HDD) 上。如需了解详情,请参阅分层存储概览。
存储空间指标
Spanner 提供以下存储空间指标:
- 数据库总存储空间:存储在数据库或实例数据库中的数据量。您需要遵守存储空间限制。
- 总备份存储空间:与实例或数据库关联的备份所存储的数据量。备份存储空间会单独存储和计费,可供您存储的数据量不受限制。
您可以在 Google Cloud 控制台或 Cloud Monitoring 控制台中查看这些指标的图表。
此外,Cloud 控制台的实例和实例详情页面中将显示数据库存储空间利用率。
多版本存储
如果您频繁使用上述存储空间指标来检查您的数据大小,您可能偶尔会遇到与您预期相反的结果。例如,即使您最近并未移除任何数据,您也可能会发现报告的数据库总存储量显著下降。相反,执行大型删除操作后,您可能会发现其大小保持不变。
这些影响源自 Spanner 对多版本存储的支持。多版本存储会将所有已删除或覆盖的数据保留在存储空间中,并在有限的时间内可供使用,以实现可让您读取先前数据值的功能,例如过时数据读取和时间点恢复。执行大型数据删除操作不会立即反映在数据库的存储空间指标中。同样,数据库总大小出现未提示的明显下降可能意味着 Spanner 的常规数据压缩过程最近清理了早在几天前删除或覆盖的大量数据。
Spanner 保证删除或覆盖的数据在 version_retention_period 选项定义的时间间隔内(默认为一小时)持续可用。它每隔几天会自动运行一个后台进程,以永久移除早于此版本保留时间间隔的所有过时数据。
分块的影响
在高负载或热点期间,Spanner 会使用分块技术,以便在预配的计算资源中更均匀地分配 CPU 利用率。分块的一个副作用是存储空间利用率会暂时增加。对于进行分块的数据,在每周压缩周期内,在给定时间最多可能会保留原始分块范围的两个副本,直到压缩周期有机会缩小分块并舍弃额外的数据副本。
存储空间统计信息
所有注入到 Spanner 中的数据通常会在几分钟内显示在存储空间统计信息中。不过,在某些情况下,即使数据可供进行读取访问(并且可通过预写式日志记录等技术实现持久性),也需要更长时间(最多几天)才能显示在存储空间利用率统计信息中。
这是因为所有注入的数据(除了在提交期间出于持久性和恢复目的而记录的副本)在后台写入到物理存储之前,都会暂时驻留在内存中。可驻留在内存中的数据量以及数据在写入到物理存储之前在内存中驻留的时间量取决于计算的大小以及工作负载的大小和性能。
创建存储空间提醒
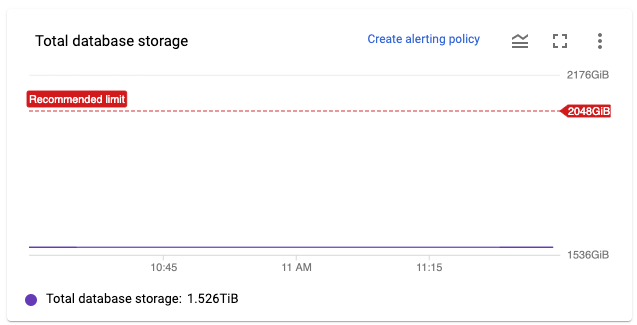
您可以在 Cloud Monitoring 控制台中创建存储空间提醒。我们还提供了一种直接从Google Cloud 控制台创建数据库存储空间提醒的简单方法。图表中的创建提醒政策链接(参见屏幕截图)会使您进入 Cloud Monitoring 控制台中的“创建提醒”页面,并自动预填充相关的字段。
关于数据库存储空间利用率的建议
我们建议您将数据库总存储空间保持在存储空间上限以下。这可确保 Spanner 有足够的余量来正常工作,并对数据执行例行维护。
如果您即将达到限制,Spanner 可能会阻止您执行超出限制的操作,例如:
- 从备份中恢复数据库。
- 修改数据库的架构(例如,添加索引)。
- 减少实例的计算容量。
如果您超出存储空间上限,Spanner 将会尝试正常运行,但由于资源压力,您可能会遇到性能下降或故障。如果您接近或超出建议的上限,Google Cloud 控制台会在显示受影响的实例时显示一条警告,内容为“此实例已达到其存储容量上限,因此可能导致活跃性降低”。
您还可以在 Cloud Monitoring 中创建提醒以通知您。
降低数据库存储空间利用率
如需降低实例的数据库存储空间利用率,您可以:
- 添加更多计算容量。
- 删除数据库。
- 从数据库中删除数据。请注意,即使数据删除会立即从可见性的角度生效,它也不会影响存储空间利用率指标,直到 Spanner 对数据进行压缩(通常 12 小时以内,但在某些情况下可能需要更长时间)。因此,您可能会注意到从删除数据到更改出现在指标中之间存在延迟。
通常,我们建议您首先将计算容量添加到实例中。添加计算容量后,您可以调查并解决存储利用率过高的根本原因。
如果要自动执行此过程,您可以创建监控数据库存储空间利用率的应用,然后根据需要使用 UpdateInstance 方法添加和移除计算容量。
后续步骤
- 使用Google Cloud 控制台或 Cloud Monitoring 控制台监控实例。
- 为 Spanner 创建提醒。
- 了解如何更改 Spanner 实例的计算容量。