When you use SQL queries to look up data, Spanner automatically uses any secondary indexes that are likely to help retrieve the data more efficiently. In a few cases, though, Spanner might choose an index that causes queries to be slower. As a result, you might notice that some queries run more slowly than they ran in the past.
This page explains how to detect changes in query execution speed; inspect the query execution plan for those queries; and specify a different index for future queries if necessary.
Detect changes in query execution speed
You are most likely to see a change in query execution speed after you make one of these changes:
- Significantly changing a large amount of existing data that has a secondary index.
- Adding, changing, or dropping a secondary index.
You can use several different tools to identify a specific query that Spanner is executing more slowly than usual:
- Query insights and Query statistics.
Application-specific metrics that you capture and analyze with Cloud Monitoring. For example, you can monitor the Count of queries metric to determine the number of queries in an instance over time and to find out what query optimizer version was used to run a query.
Client-side monitoring tools that measure your application's performance.
A note about new databases
When querying newly-created databases with freshly inserted or imported data, Spanner might not select the most appropriate indexes, because the query optimizer takes up to three days to collect optimizer statistics automatically. To optimize a new Spanner database's index usage sooner than that, you can manually construct a new statistics package.
Review the schema
After you find the query that slowed down, look at the SQL statement for the query, and identify the tables that the statement uses and the columns that it retrieves from those tables.
Next, find the secondary indexes that exist for those tables. Determine whether any of the indexes include the columns you're querying, which means that Spanner might use one of the indexes to process the query.
- If there are applicable indexes, the next step is to find the index that Spanner used for the query.
If there are no applicable indexes, use the
gcloud spanner operations
list
command to check whether you recently dropped an applicable index:gcloud spanner operations list \ --instance=INSTANCE \ --database=DATABASE \ --filter="@TYPE:UpdateDatabaseDdlMetadata"If you dropped an applicable index, that change might have affected query performance. Add the secondary index back to the table. After Spanner adds the index, run the query again and look at its performance. If performance does not improve, the next step is to find the index that Spanner used for the query.
If you did not drop an applicable index, then index selection did not cause query performance to regress. Look for other changes to your data or usage patterns that might have affected performance.
Find the index used for a query
To find out what index Spanner is using to process a query, view the query execution plan in the Google Cloud console:
Go to the Spanner Instances page in the Google Cloud console.
Click the name of the instance you want to query.
In the left pane, click the database you want to query, then click Spanner Studio.
Enter the query to test.
In the Run query drop-down list, select Explanation only. Spanner displays the query plan.
Look for at least one of the following operators in the query plan:
- Table scan
- Index scan
- Cross apply or distributed cross apply
The following sections explain the meaning of each operator.
Table scan operator
The table scan operator indicates that Spanner did not use a secondary index:
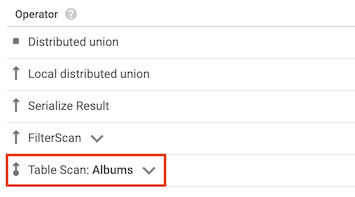
For example, suppose that the Albums table does not have any secondary
indexes, and you run the following query:
SELECT AlbumTitle FROM Albums WHERE STARTS_WITH(AlbumTitle, "Now");
Because there are no indexes to use, the query plan includes a table scan operator.
Index scan operator
The index scan operator indicates that Spanner used a secondary index when it processed the query:
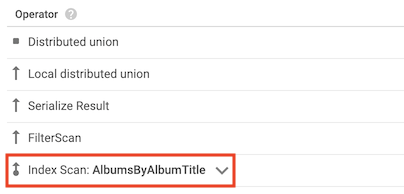
For example, suppose you add an index to the Albums table:
CREATE INDEX AlbumsByAlbumTitle ON Albums(AlbumTitle);
Then you run the following query:
SELECT AlbumTitle FROM Albums WHERE STARTS_WITH(AlbumTitle, "Now");
The AlbumsByAlbumTitle index contains AlbumTitle, which is the only column
that the query selects. As a result, the query plan includes an index scan
operator.
Cross apply operator
In some cases, Spanner uses an index that contains only some of the columns that the query selects. As a result, Spanner must join the index with the base table.
When this type of join occurs, the query plan includes a cross apply or distributed cross apply operator that has the following inputs:
- An index scan operator for a table's index
- A table scan operator for the table that owns the index
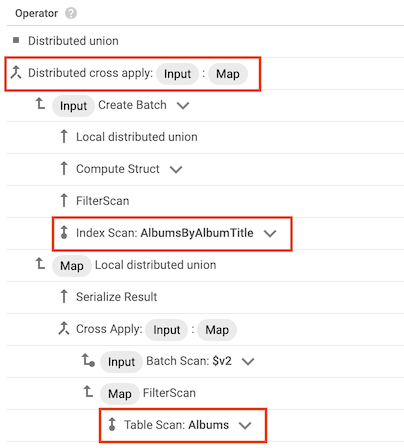
For example, suppose you add an index to the Albums table:
CREATE INDEX AlbumsByAlbumTitle ON Albums(AlbumTitle);
Then you run the following query:
SELECT * FROM Albums WHERE STARTS_WITH(AlbumTitle, "Now");
The AlbumsByAlbumTitle index contains AlbumTitle, but the query selects all
of the columns in the table, not just AlbumTitle. As a result, the query plan
includes a distributed cross apply operator, with an index scan of
AlbumsByAlbumTitle and a table scan of Albums as its inputs.
Choose a different index
After you find the index that Spanner used for your query, try
running your query with a different index, or by scanning the base table instead
of using an index. To specify the index, add a FORCE_INDEX directive to the
query.
If you find a faster version of the query, update your application to use the faster version.
Guidelines for choosing an index
Use these guidelines to decide what index to test for the query:
If your query meets any of these criteria, try using the base table instead of a secondary index:
- The query checks for equality with a prefix of the base table's primary
key (for example,
SELECT * FROM Albums WHERE SingerId = 1). - A large number of rows satisfy the query predicates (for example,
SELECT * FROM Albums WHERE AlbumTitle != "There Is No Album With This
Title"
). - The query uses a base table that contains only a few hundred rows.
- The query checks for equality with a prefix of the base table's primary
key (for example,
If the query contains a very selective predicate (for example,
REGEXP_CONTAINS,STARTS_WITH,<,<=,>,>=, or!=), try using an index that includes the same columns that you use in the predicate.
Test the updated query
Use the Google Cloud console to test the updated query and find out how long it takes to process the query.
If your query includes query parameters, and a query
parameter is bound to some values much more often than others, then bind the
query parameter with one of those values in your tests. For example, if the
query includes a predicate such as WHERE country = @countryId, and almost all
of your queries bind @countryId to the value US, then bind @countryId to
US for your performance tests. This approach helps you optimize for the
queries you run most frequently.
To test the updated query in the Google Cloud console, follow these steps:
Go to the Spanner Instances page in the Google Cloud console.
Click the name of the instance you want to query.
In the left pane, click the database you want to query, then click Spanner Studio.
Enter the query to test, including the
FORCE_INDEXdirective, and click Run query.The Google Cloud console opens the Results table tab, then shows the query results, including how long it took for the Spanner service to process the query.
This metric does not include other sources of latency, such as the time it took for the Google Cloud console to interpret and display the query results.
Get the detailed profile of a query in JSON format using the REST API
By default, only statement results are returned when you execute a query. This
is because QueryMode is set to NORMAL. To include detailed
execution statistics with the query results, set QueryMode to PROFILE.
Create a session
Before you update your query mode, create a session, which represents a communication channel with the Spanner database service.
- Click
projects.instances.databases.sessions.create. Provide the project, instance, and database ID in the following form:
projects/[\PROJECT_ID]/instances/[\INSTANCE_ID]/databases/[\DATABASE_ID]
Click Execute. The response shows the session that you created in this form:
projects/[\PROJECT_ID]/instances/[\INSTANCE_ID]/databases/[\DATABASE_ID]/sessions/[\SESSION]
You will use it to perform the query profile in the next step. The created session will be alive for at most one hour between consecutive uses before it is deleted by the database.
Profile the query
Enable PROFILE mode for the query.
- Click
projects.instances.databases.sessions.executeSql. For session, enter the session ID you created in the previous step:
projects/[PROJECT_ID]/instances/[INSTANCE_ID]/databases/[DATABASE_ID]/sessions/[SESSION]
For Request body, use the following:
{ "sql": "[YOUR_SQL_QUERY]", "queryMode": "PROFILE" }
Click Execute. The returned response will include the query results, query plan, and the execution statistics for the query.