You can download a Looker dashboard in PDF or CSV format. You can send or schedule a Looker dashboard in PDF, PNG, or CSV format.
PDF and PNG formats are considered rendered formats. This page provides examples of the types of output these rendered formats produce, given different settings in Looker.
For customer-hosted Looker instances, installation of Chromium is required to output rendered formats.
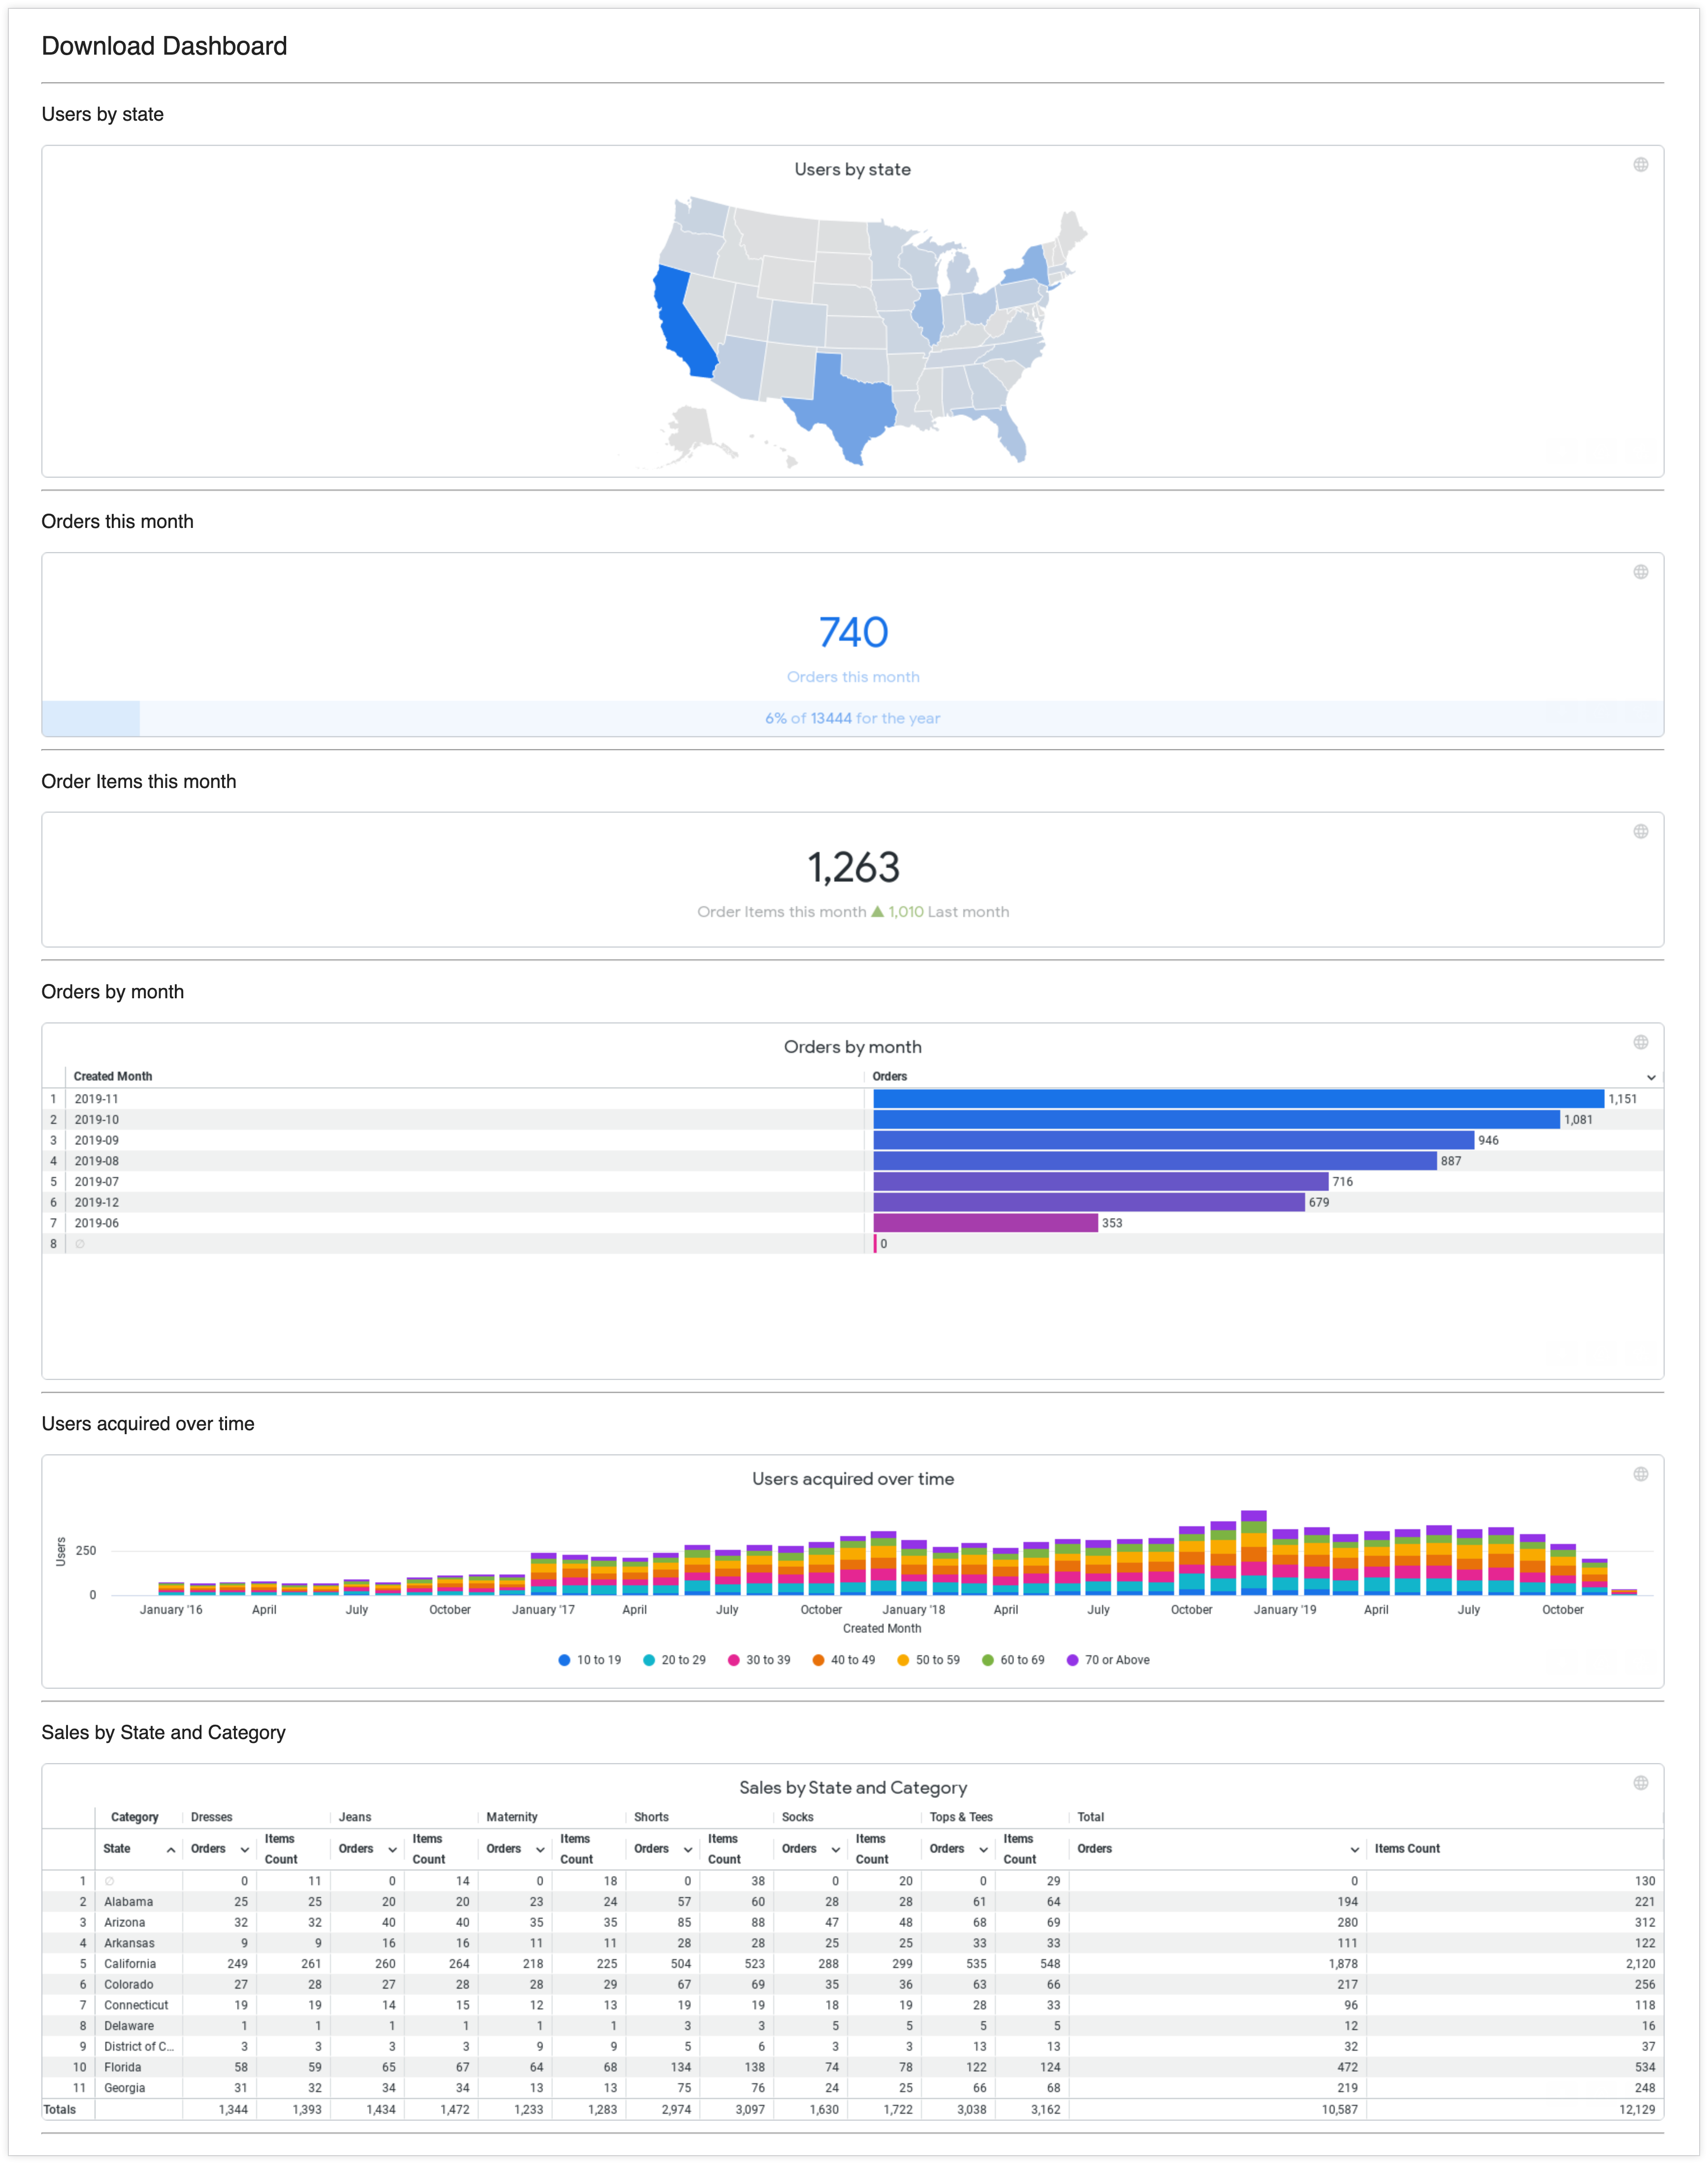
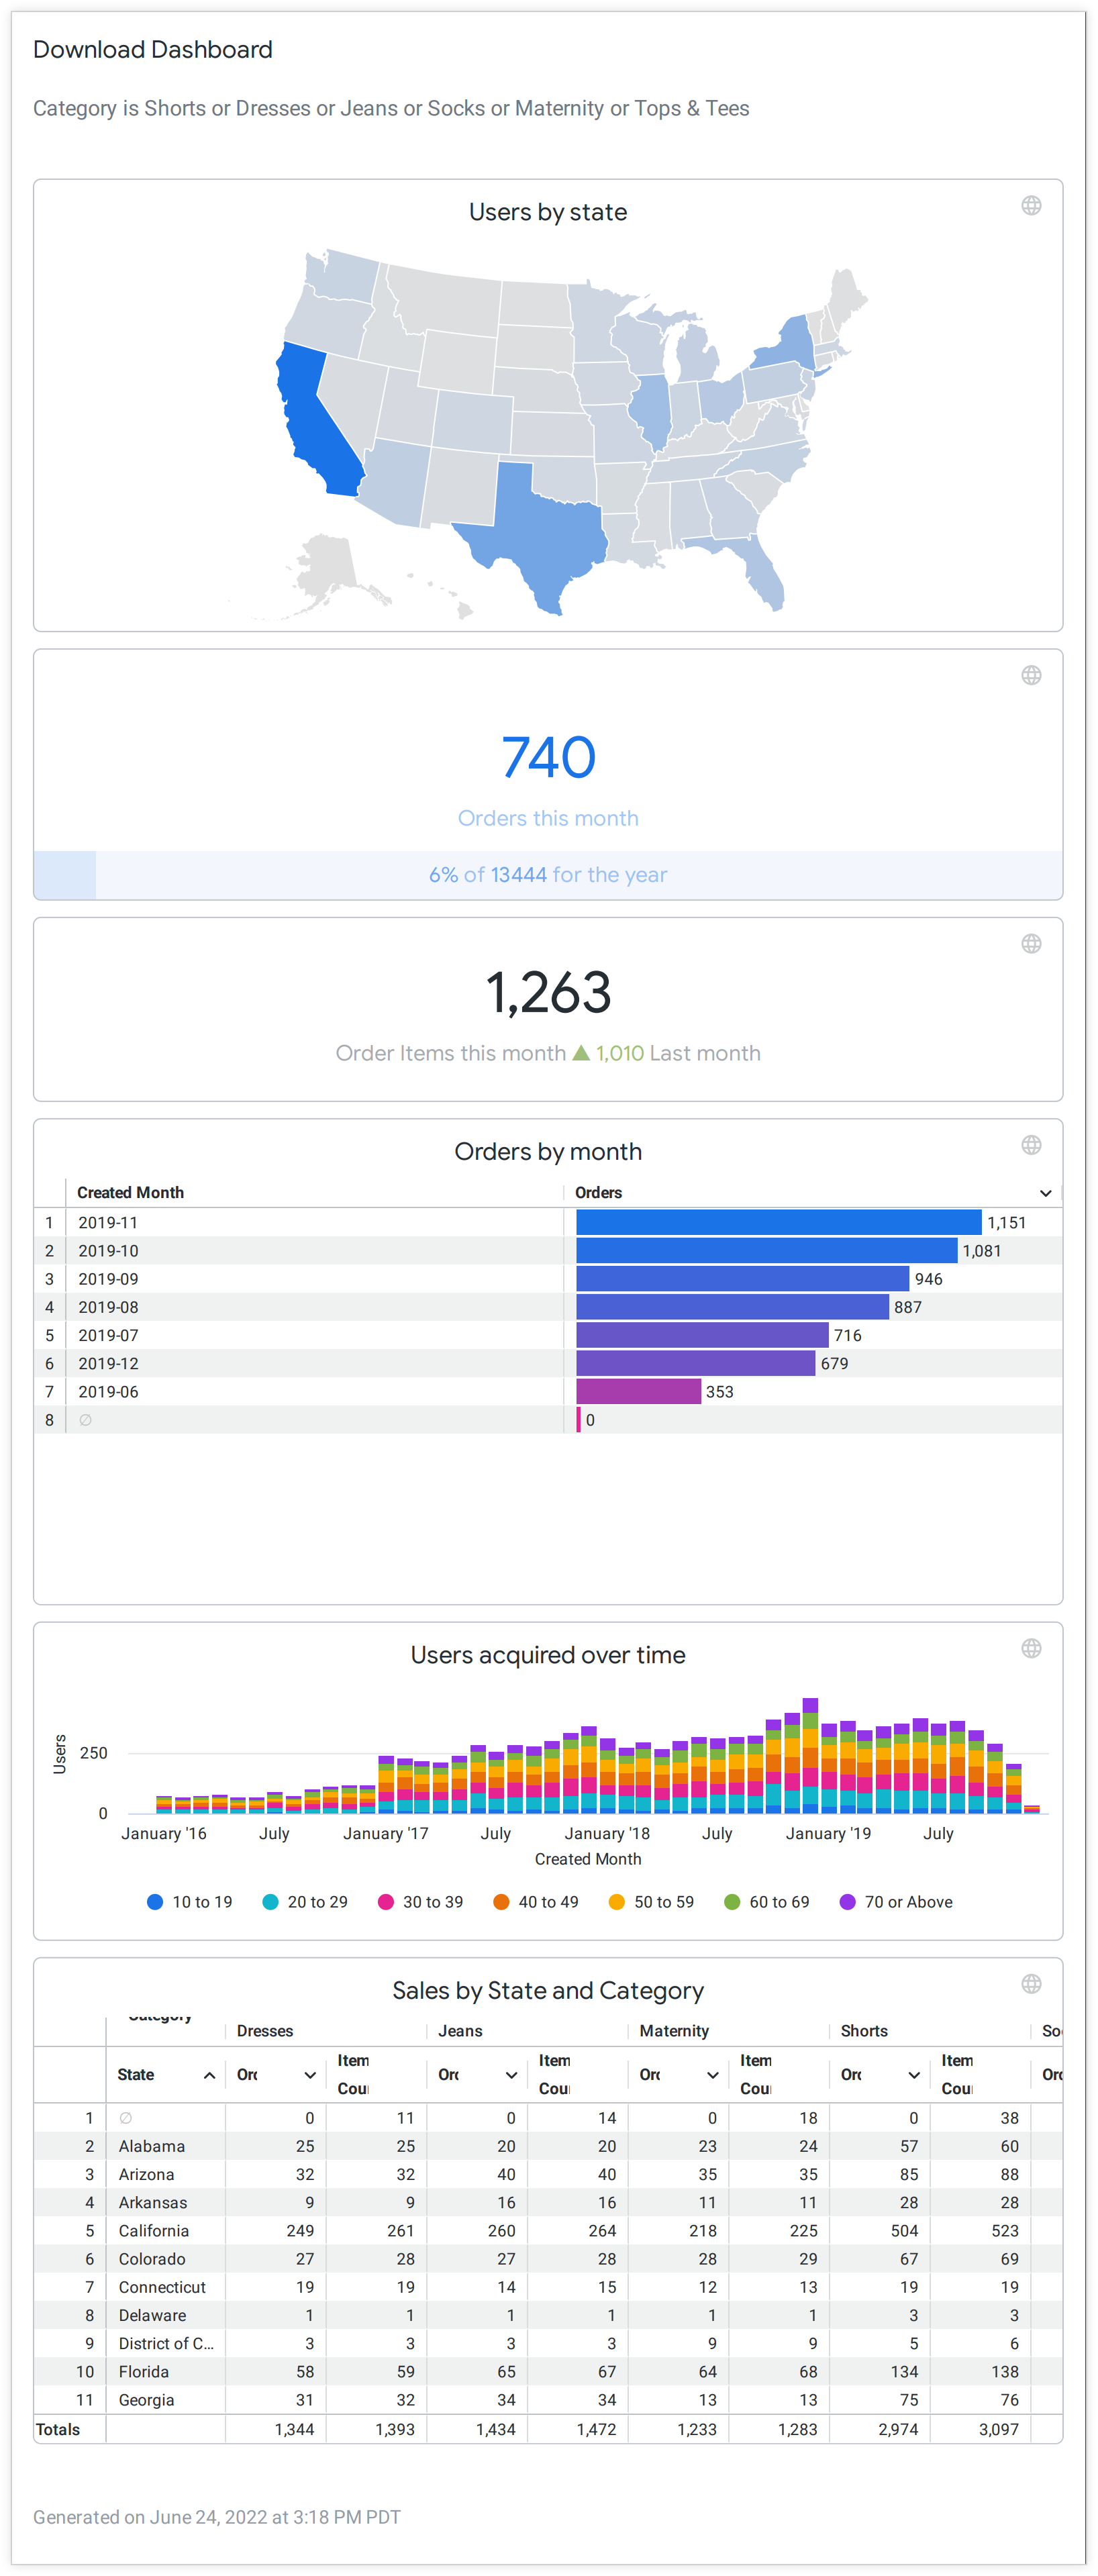
All examples on this page use a dashboard called Download Dashboard, which features tiles with different chart types:
- A Users by state tile with a map chart
- Two tiles with single value charts — Orders this month and Order items this month
- An Orders by month tile with a table chart that features two columns of values that are represented as text and as a bar chart.
- A Users acquired over time tile with a column chart
- A Sales by State and Category tile with a table chart with values that are represented as text.
PDFs
To output PDFs, follow the instructions for downloading a dashboard as a PDF or, when sending or scheduling a dashboard, choosing the PDF format.
By default, a PDF file mirrors what you see when you view the dashboard in your browser at a width of 1680 pixels. Here is an example of a PDF download with Looker's default settings:
You can change the appearance of the dashboard in the PDF by adjusting several Looker settings. When scheduling and sending, you can find these settings in the Advanced options tab of the Schedule or Send windows. When downloading, you can find these settings in the download window.
- Paper Size: This setting lets you specify the optimal size and orientation of dashboard PDFs.
- Expand tables to show all rows: This setting lets you choose whether to display all rows of any table visualizations in the dashboard — rather than just those rows that display in the dashboard tile thumbnails.
- Arrange dashboard tiles in a single column: This setting lets you choose whether to display the dashboard in a single-column layout.
PDFs and the Paper Size setting
The default for the Paper Size setting is the Fit Page to Dashboard option; it sizes the PDF to match the layout of the dashboard on the screen.
Other paper size options size the PDF to match a standard paper size and fit the dashboard within it. You may be asked to choose an Orientation of portrait or landscape. Depending on the layout of the dashboard, large visualizations or groups of overlapping tiles may need to be resized to fit on a given page size.
The Paper Size option may also introduce page breaks to format the content appropriately to the paper size and orientation you select. When a Paper Size is specified, Looker determines "rows" of elements that page breaks will form around. Looker does this to avoid inserting page breaks in the middle of visualizations.
When you specify the paper size and orientation, consider element size and dashboard layout. Dashboard tiles may need to be reorganized to accommodate the selected page size and Looker-determined line breaks. For example, page breaks may occur in very tall dashboard elements or in overlapping groups of tiles, producing a garbled PDF.
See the following section for an example of what a PDF with a non-default Paper Size setting looks like.
PDFs and the Expand tables to show all rows setting
The Expand tables to show all rows setting is disabled by default.
When enabled, this setting displays all rows of a table visualization, rather than just the rows that are visible in the tile thumbnail. Looker determines groups of dashboard tiles to break into rows (similar to how it determines page breaks). Then, Looker uses a CSS grid layout to position the groups of tiles to accommodate the expansion. Expanding the table increases the size of the grid rows, causing the elements around the expanded tables to move along with the expanded table.
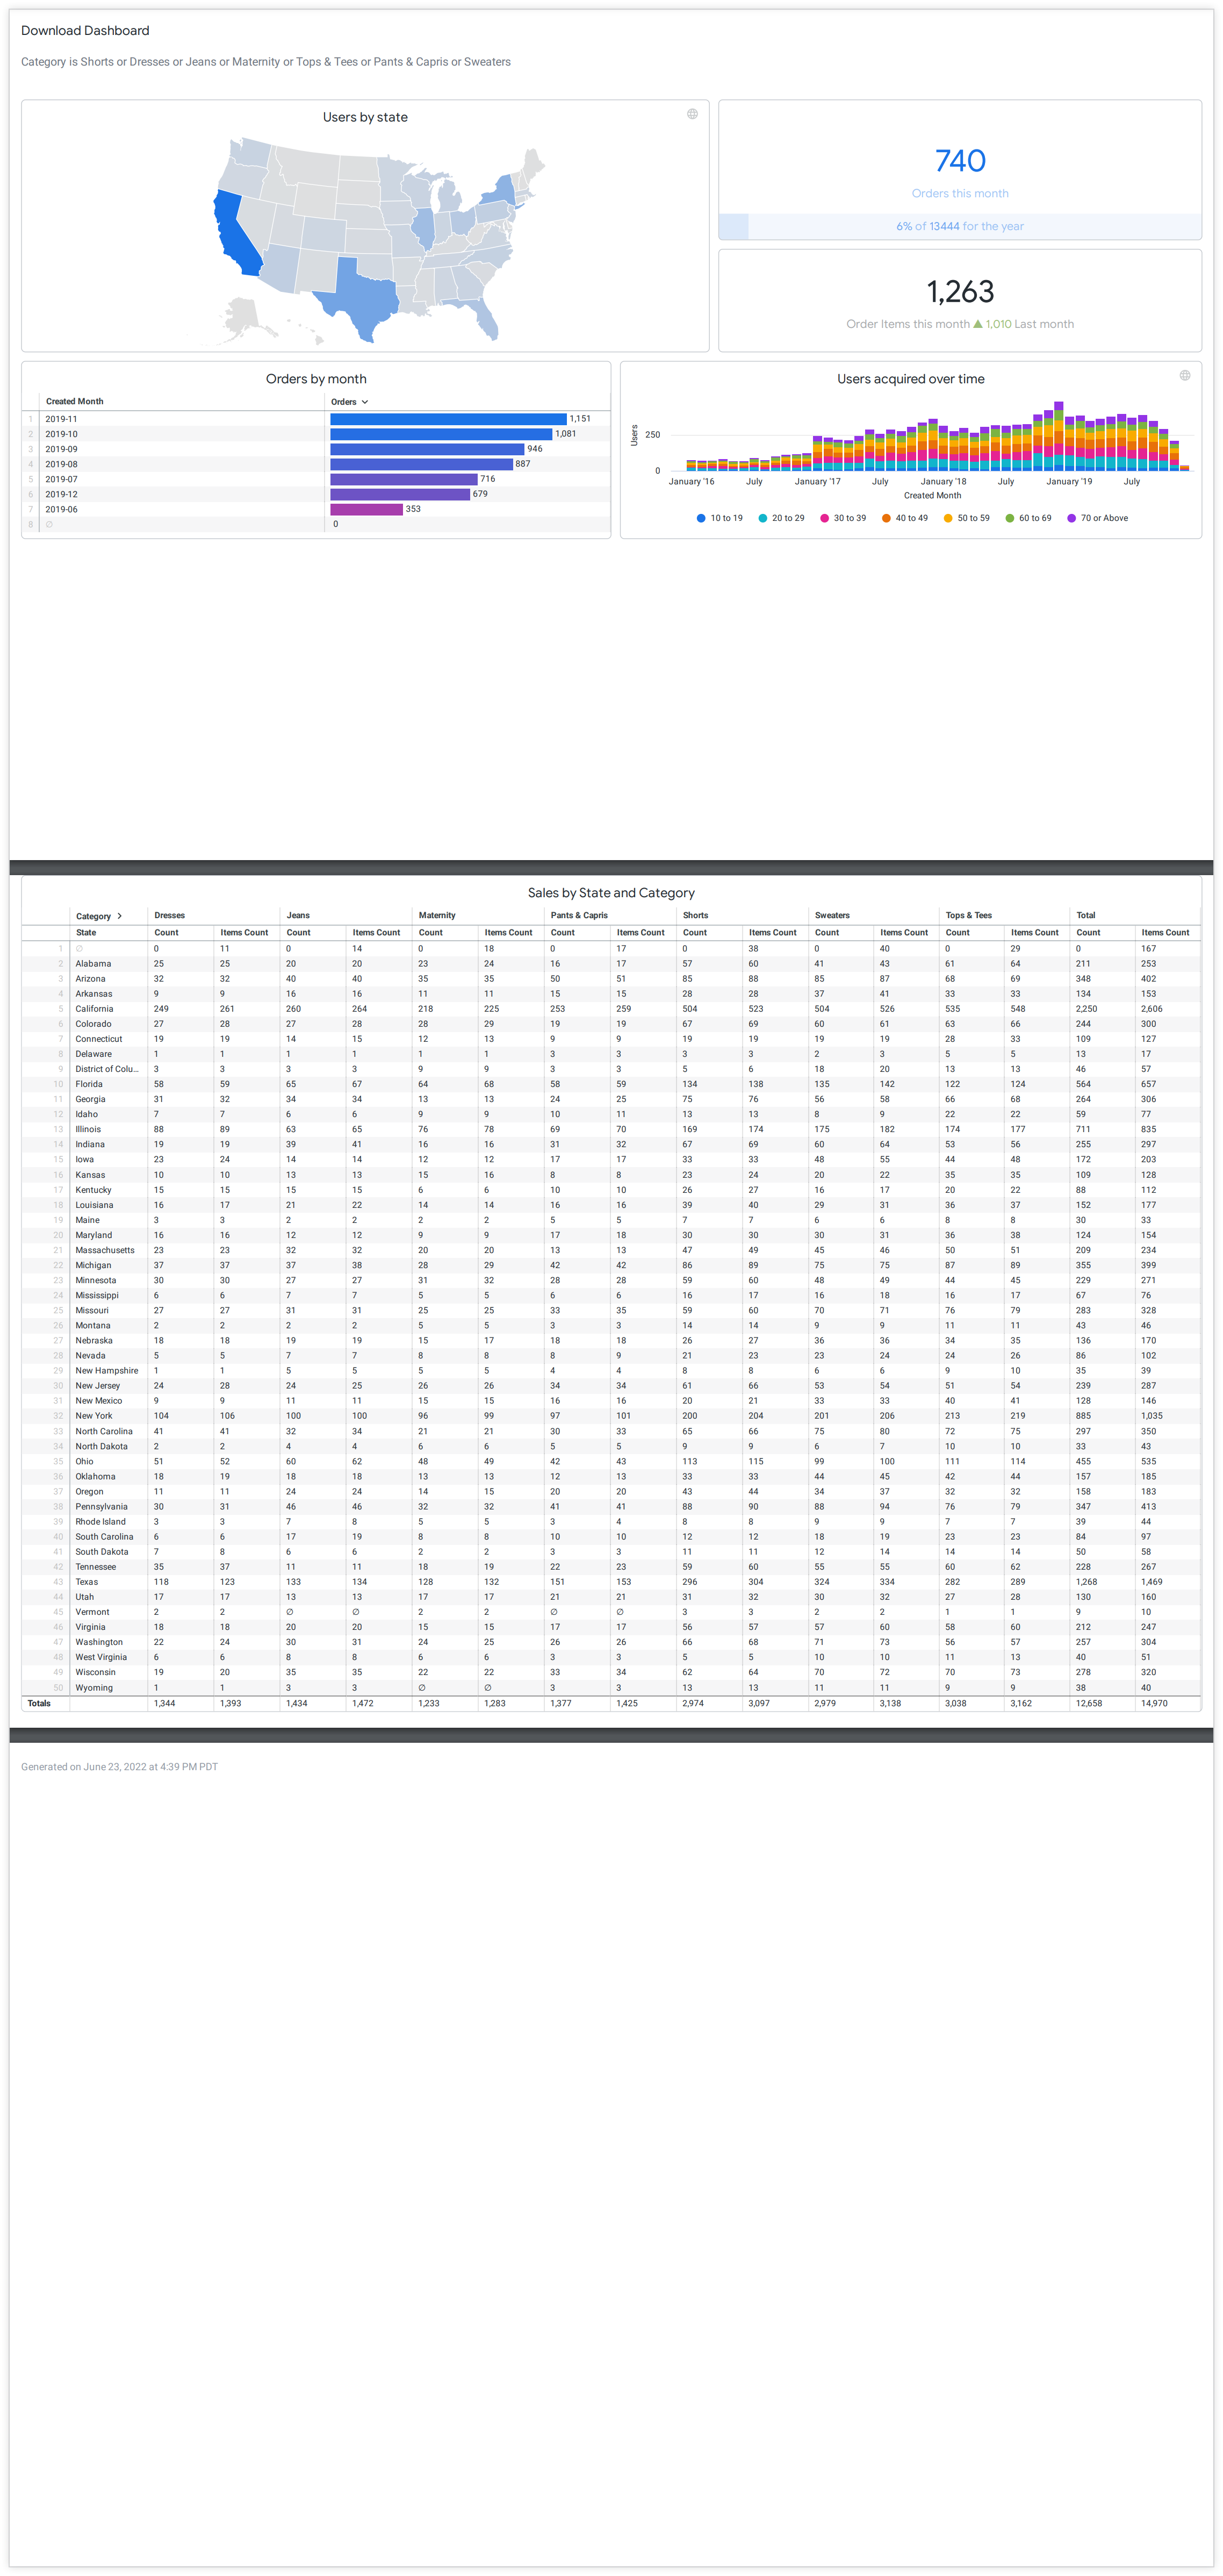
The following image shows what a PDF of the example dashboard would look like with a Paper Size setting of A5 (5.83 in. x 8.27 in.), a portrait Orientation, and an enabled Expand tables to show all rows setting. The tiles have been resized to fit the A5 width, the table tile at the bottom shows all rows of the table, and page breaks have been inserted between the tiles and also before the timestamp at the bottom of the PDF.
PDFs and the Arrange dashboard tiles in a single column setting
The Arrange dashboard tiles in a single column setting is disabled by default.
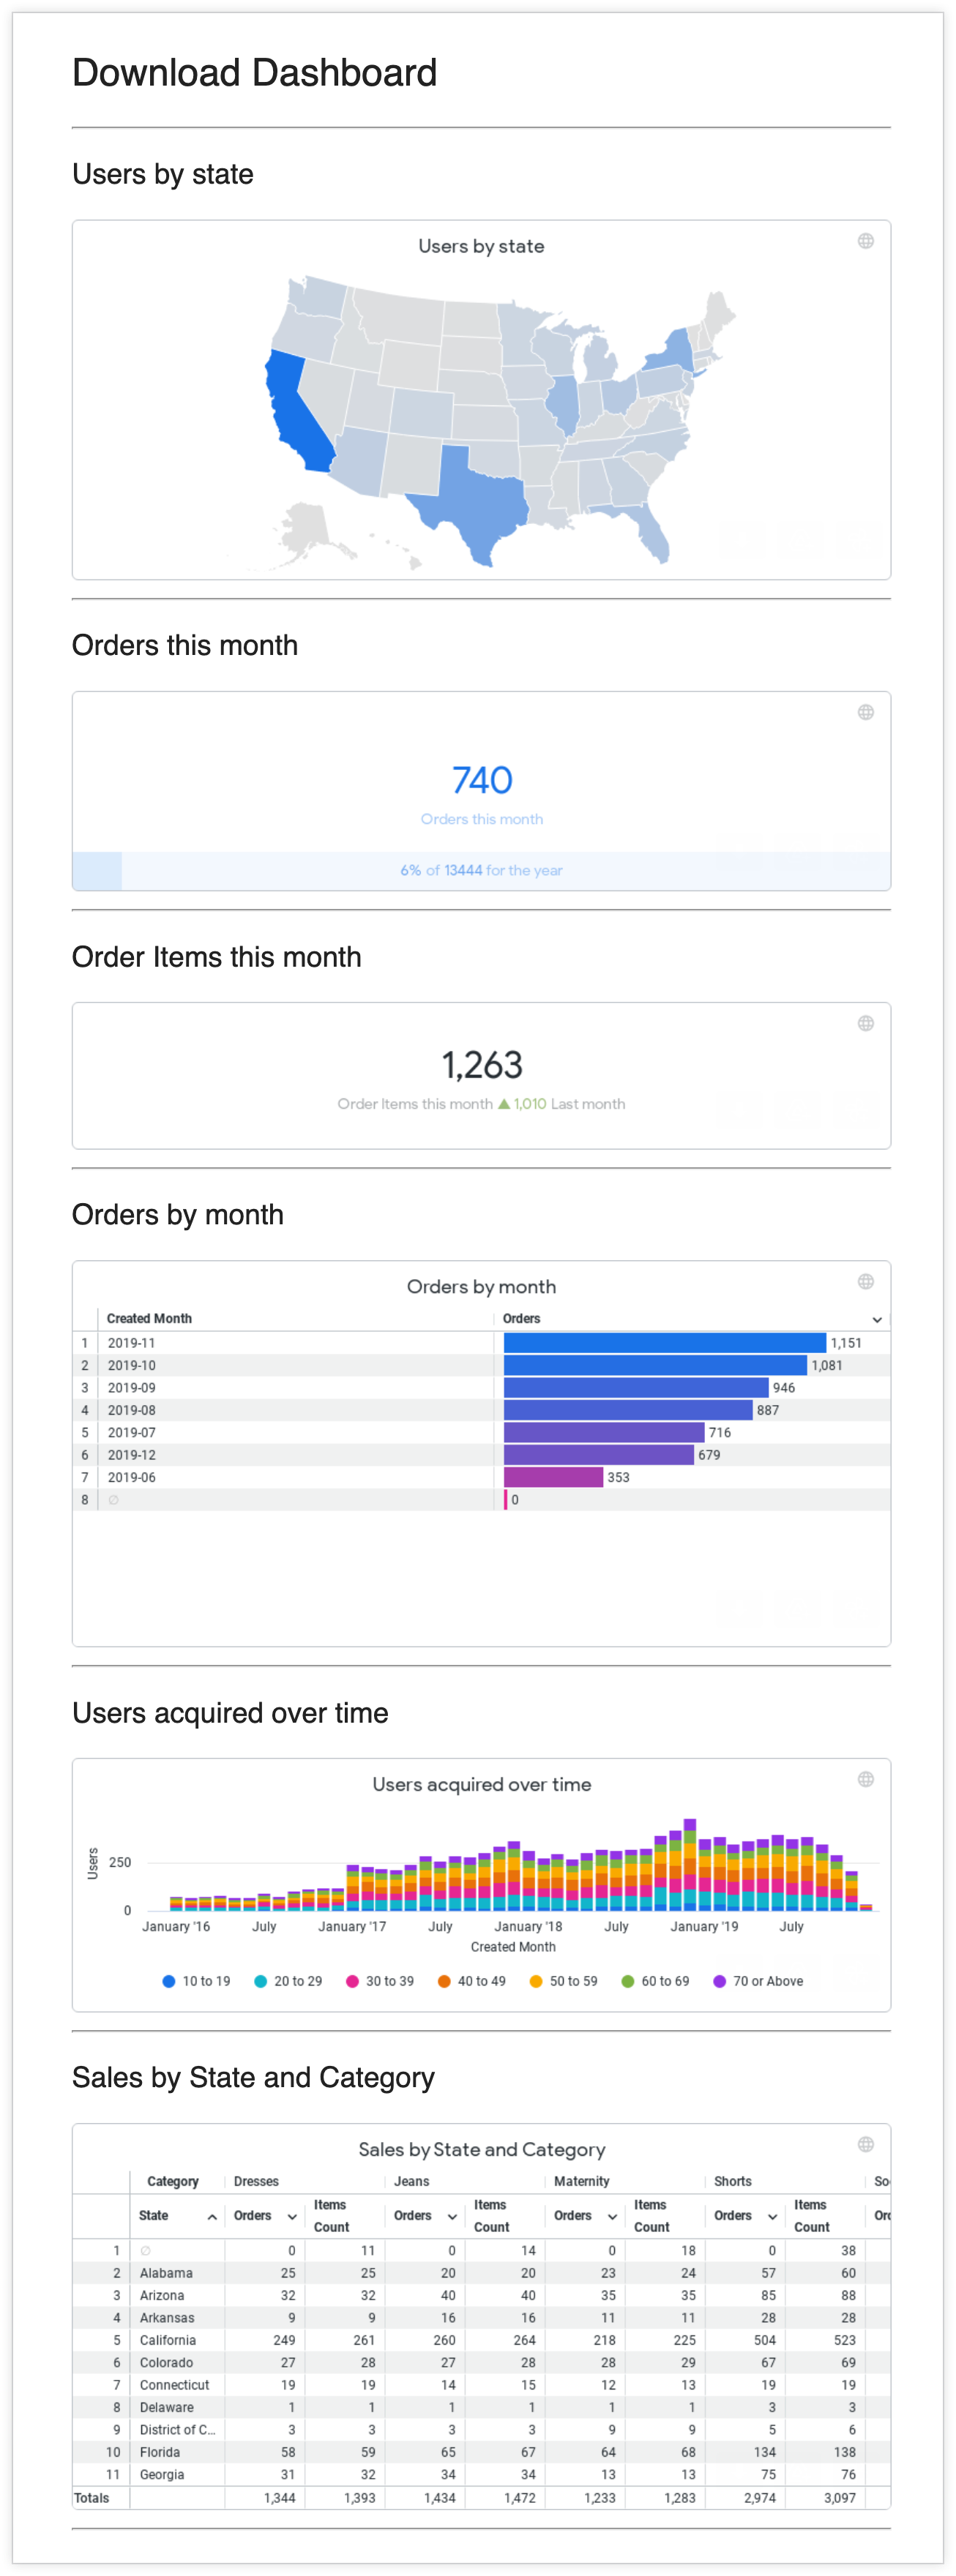
A single-column PDF stacks each dashboard tile in a single column. The width of the PDF and dashboard tiles is 800 pixels. Wide tables will be scaled to fit within the 800-pixel, single-column rendering.
Here is the example dashboard rendered as a single column PDF:
Single column PDFs with the Expand tables to show all rows option applied often render with page breaks in the middle of expanded tables. However, no data should be cut off.
PNGs
The PNG format is available only when you send or schedule dashboards. It is not available when you download dashboards.
For the most part, PNG files render the same as PDF files, with a few differences:
- When the Arrange dashboard tiles in a single column setting is selected, each tile renders as an individual PNG file rather than all tiles rendering together as a single file.
- The Paper Size and Expand tables to show all rows settings are not available for PNG.
- The only options for adjusting the appearance of PNG deliveries are the Arrange dashboard tiles in a single column setting and the Table resolution setting.
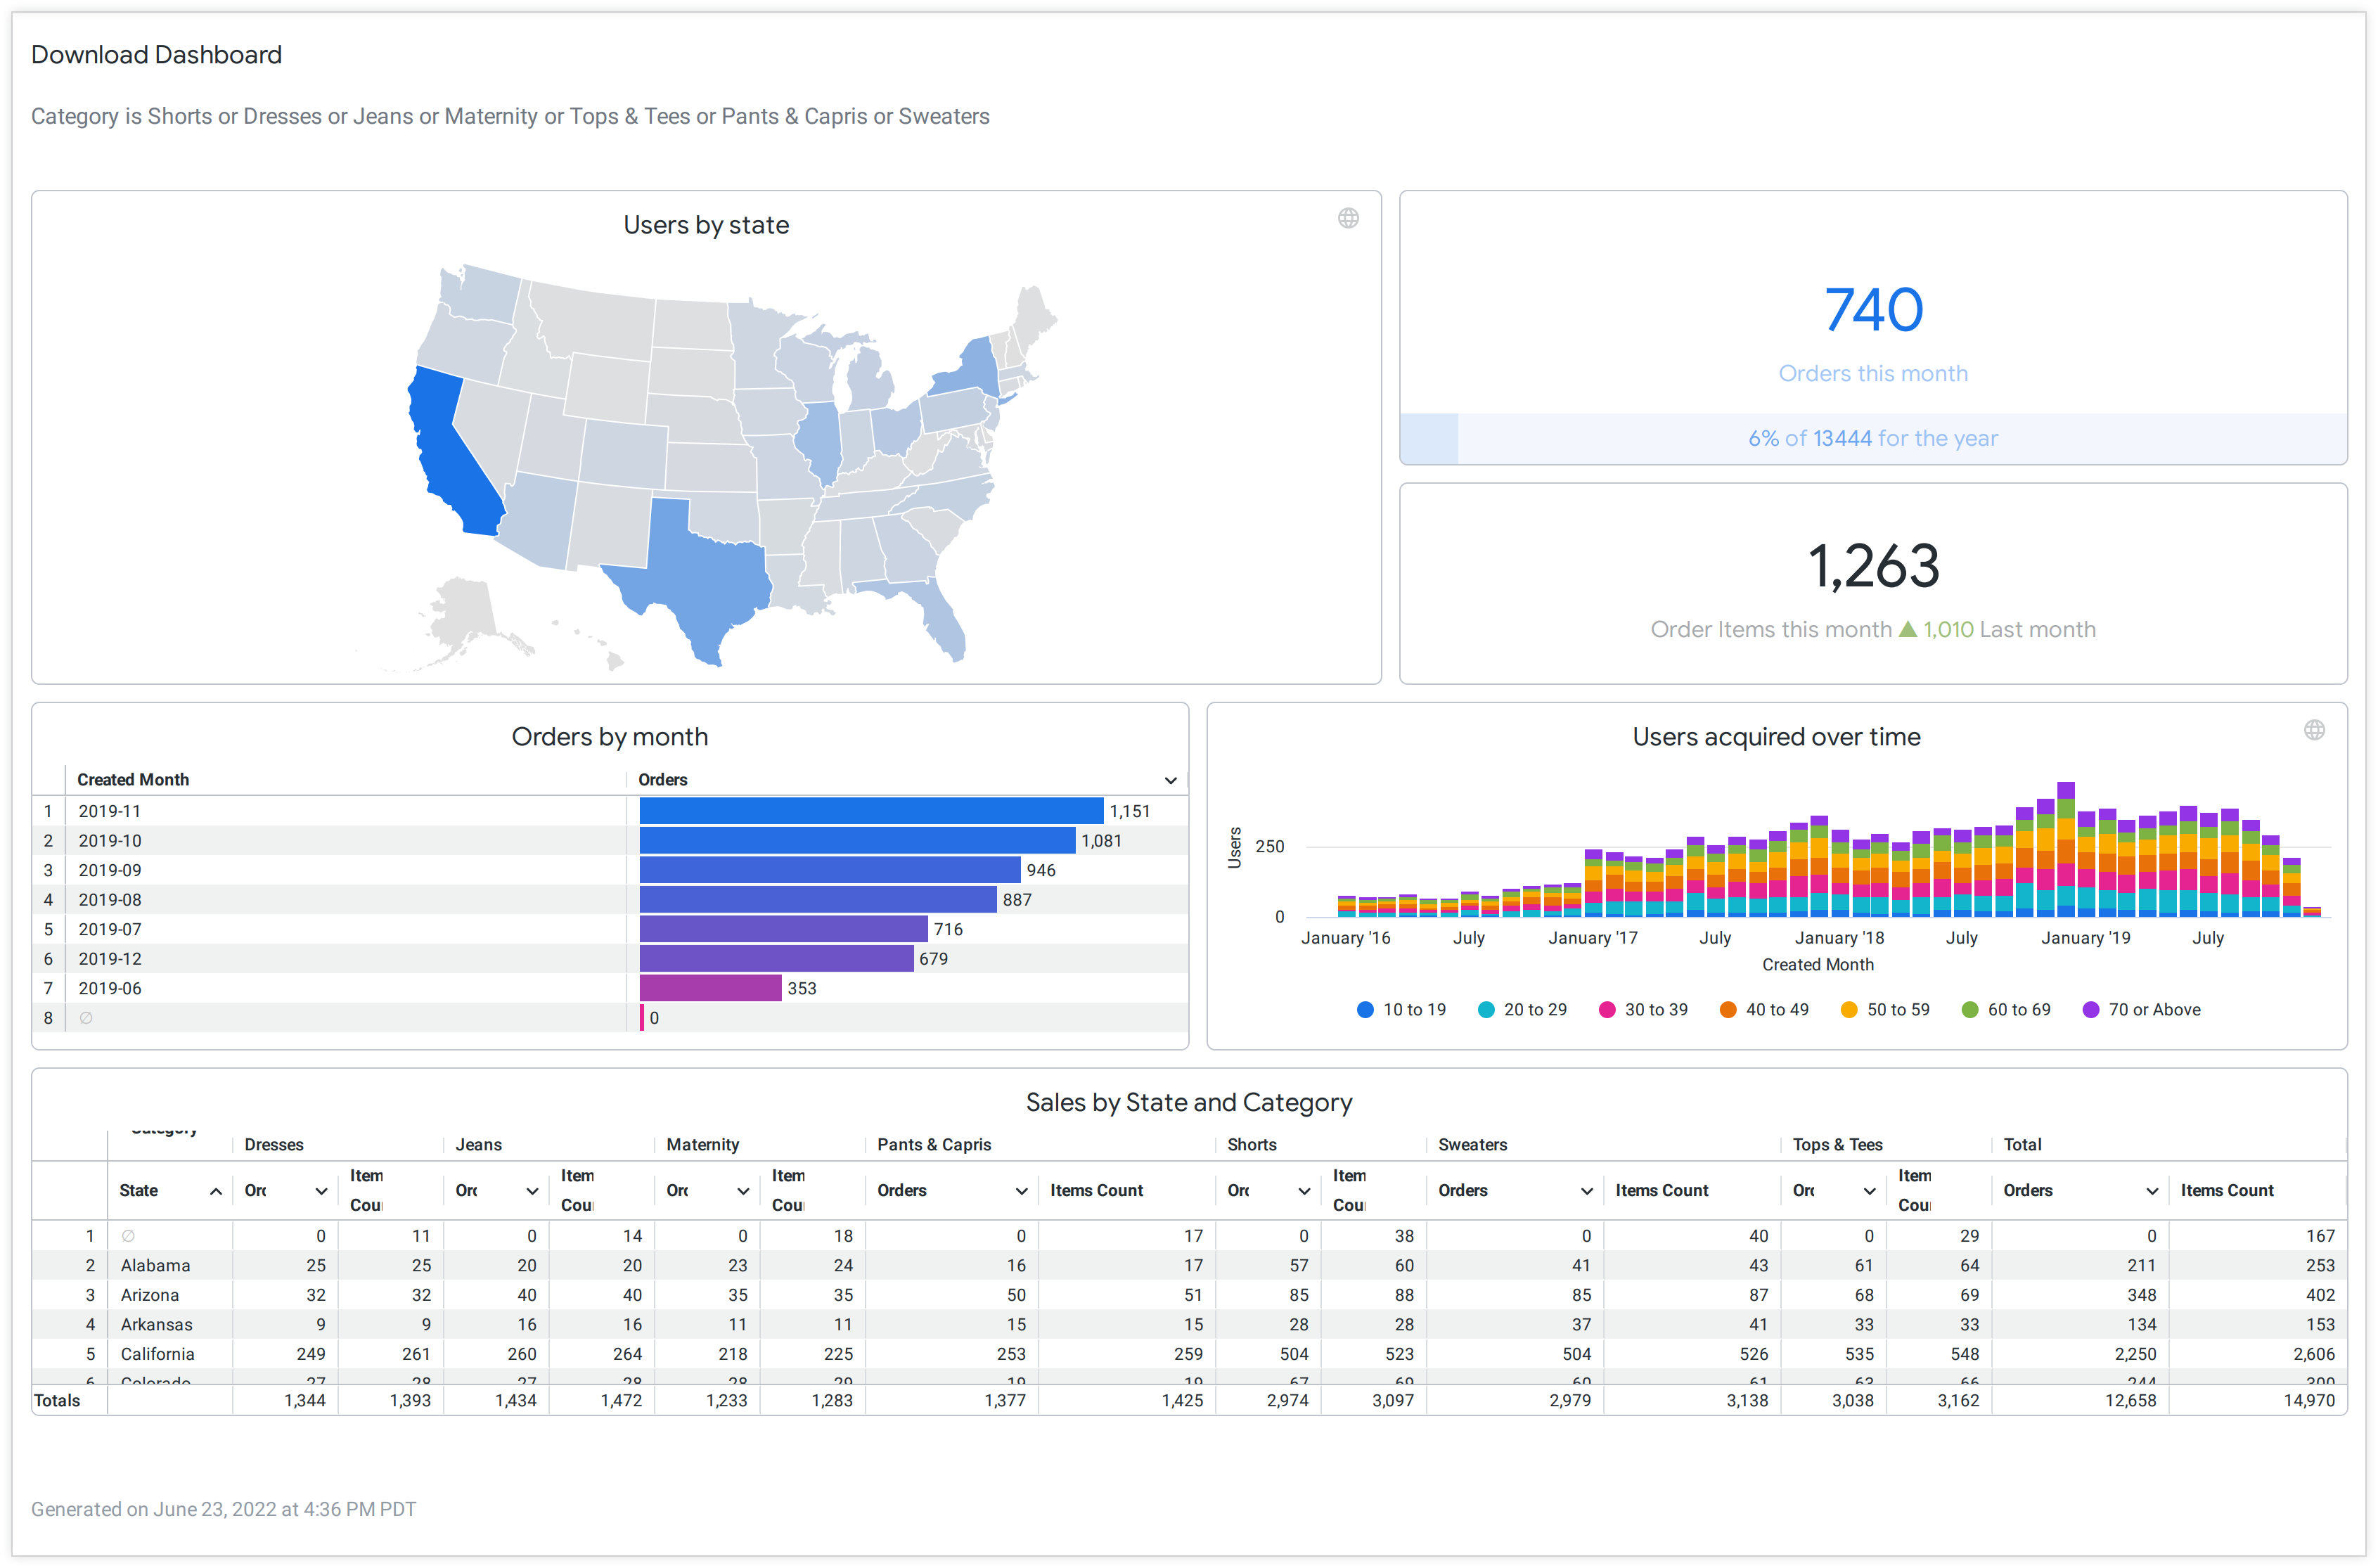
Here is what the delivery looks like when the Table resolution setting is set to Normal. Notice that the wide table, Orders by State and Category, is cut off — not all columns are rendered:
Here is what the delivery looks like when the Table resolution setting is set to Wide. Recipients may need to scroll horizontally to see the entirety of the tiles: