Livre de recettes pour tirer le meilleur parti des visualisations Looker: personnalisation des info-bulles
Restez organisé à l'aide des collections
Enregistrez et classez les contenus selon vos préférences.
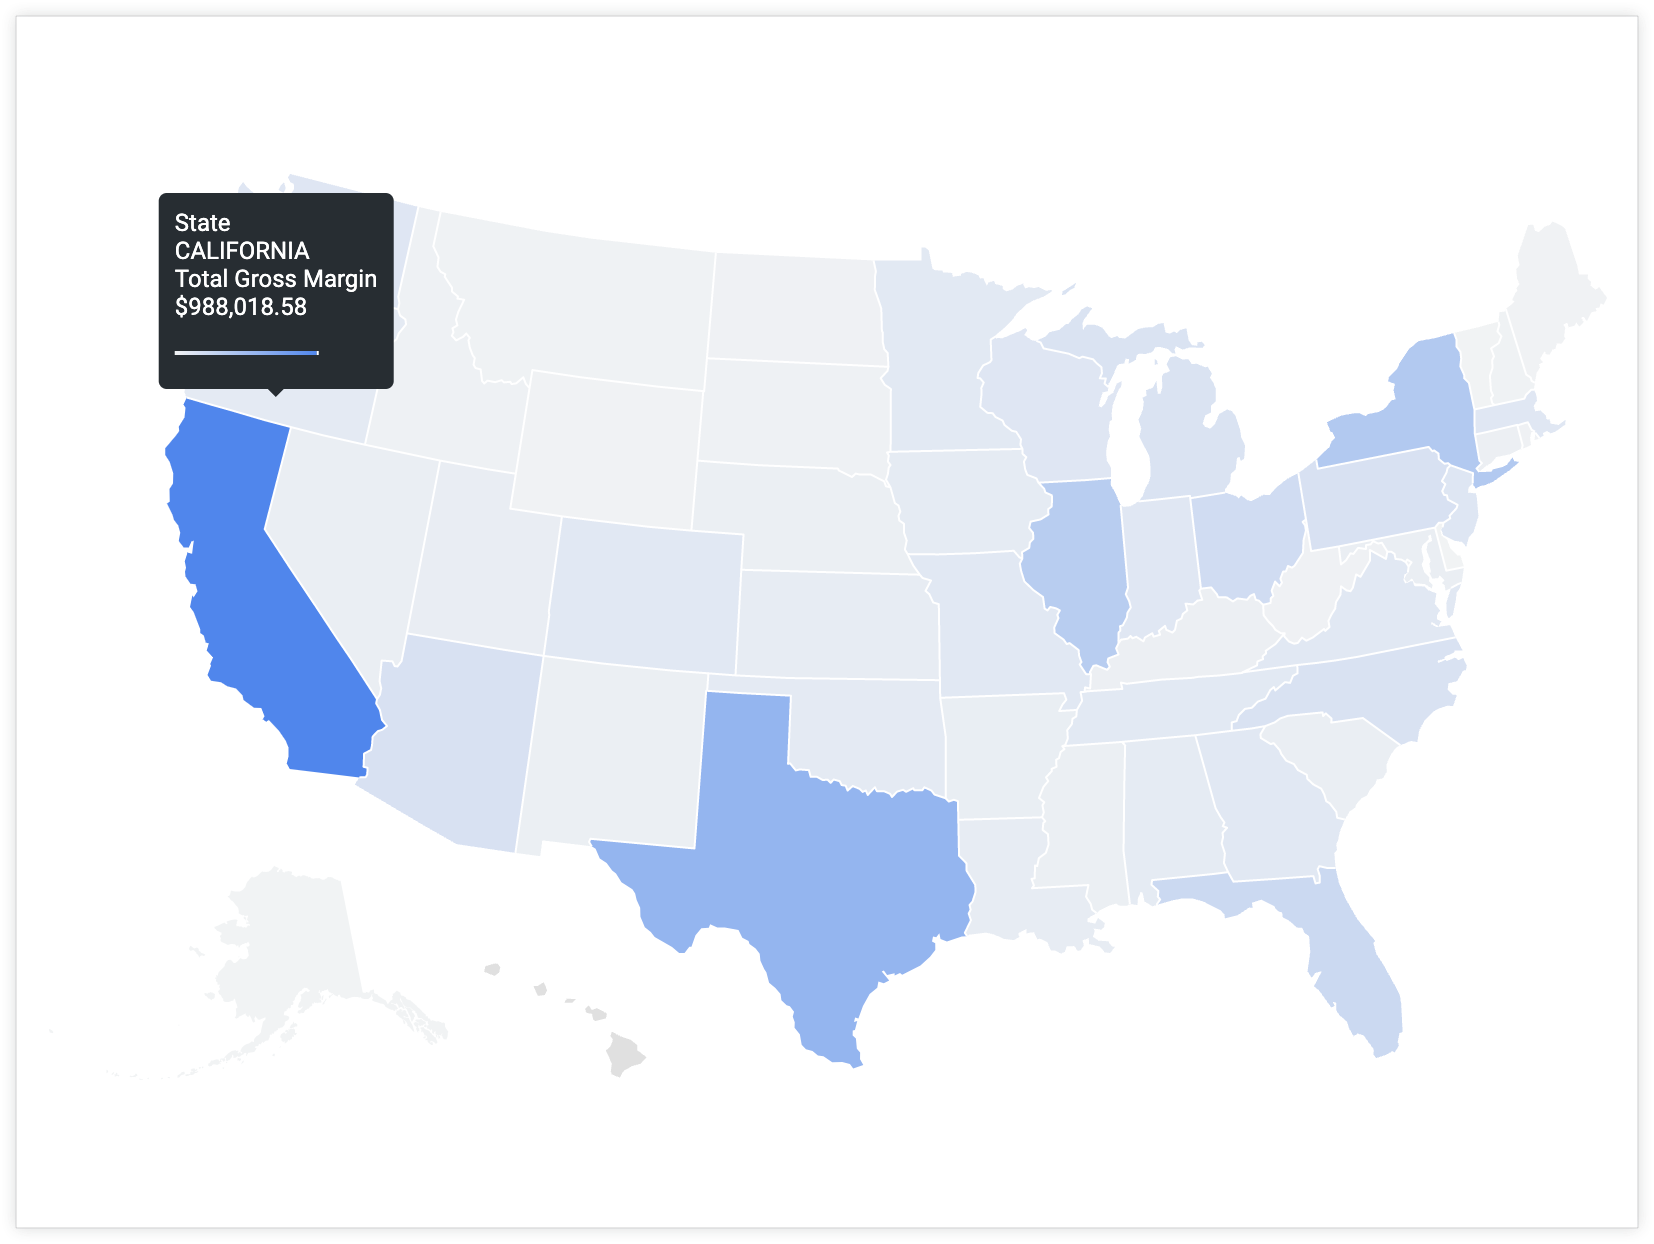
L'info-bulle de la visualisation affiche par défaut la valeur des dimensions et mesures sélectionnées. Elle peut aider les utilisateurs à comprendre l'importance d'un seul point de données.
Par exemple, une info-bulle pour une visualisation cartographique basée sur la marge brute totale regroupée par État affiche les valeurs des deux champs lorsqu'un utilisateur pointe sur la Californie.
Toutefois, que faire si vous souhaitez inclure des champs autres que les champs par défaut dans l'info-bulle afin que les utilisateurs puissent obtenir plus d'informations ou de contexte sur un point de données sans avoir à chercher ailleurs ?
Vous pouvez personnaliser l'info-bulle pour afficher les valeurs de plusieurs champs spécifiés, y compris des champs qui ne figurent pas dans la requête d'exploration.
Ingrédients
Variables Liquid : les variables Liquid affichent les valeurs d'autres champs en association avec la requête d'exploration existante.
Paramètre html : les champs définis dans le paramètre html d'une mesure s'affichent dans l'info-bulle lorsqu'un utilisateur pointe sur une visualisation.
Visualisation : l'info-bulle s'affiche lorsque l'utilisateur pointe sur un point de données dans certains types de visualisation.
Autorisations pour enregistrer du contenu (si vous souhaitez enregistrer la visualisation en tant que présentation ou tableau de bord)
Considérations concernant la personnalisation des info-bulles
Lorsque vous personnalisez une info-bulle, tenez compte des points suivants:
Les valeurs du paramètre html deviennent l'axe Y d'une visualisation.
La valeur que vous souhaitez afficher sur l'axe des ordonnées doit correspondre à celle du paramètre sql de la mesure.
Lorsque vous utilisez une mesure formatée (une mesure de type: percent_of_total ou une mesure avec un paramètre value_format_name ou value_format), veillez à utiliser la syntaxe Liquid pour la valeur affichée {{ field_name._rendered_value }} (où field_name est le nom réel de la mesure ou de la dimension).
Exemple
Par défaut, l'info-bulle des points de données de la visualisation inclut les valeurs de Marge brute totale et État. Toutefois, que faire si vous souhaitez fournir aux utilisateurs des informations supplémentaires qui ne figurent pas sur la carte ni dans la requête Explorer ? Que faire si vous souhaitez inclure la valeur d'un champ appelé Pourcentage de la marge brute totale au lieu de État ? L'inclusion de la Pourcentage de la marge brute totale permet aux utilisateurs de comprendre comment la valeur de la marge brute totale d'un point de données individuel se compare à la marge brute totale de l'ensemble de données.
Pour personnaliser l'info-bulle, procédez comme suit:
measure: total_gross_margin {
type: sum
value_format_name: decimal_2
sql: ${gross_margin} ;;
html: {{ rendered_value }} | {{percent_of_gross_margin._rendered_value }} of total ;;
}
En mode développement, accédez à la définition LookML du champ que vous souhaitez personnaliser.
Déterminez les champs et les valeurs que vous souhaitez inclure dans l'info-bulle en plus du champ d'origine. Par exemple, Pourcentage de la marge brute totale.
Ajoutez un paramètre html à la mesure d'origine référencée dans la requête d'exploration et affichée dans l'info-bulle. Dans ce cas, la mesure actuellement présente dans la requête d'exploration et affichée dans l'info-bulle est Marge brute totale.
Dans le paramètre html, créez une expression avec des variables Liquid qui ajoute les champs supplémentaires à la valeur de la mesure existante.
Cet exemple utilise la variable Liquid _rendered_value pour afficher des valeurs formatées Looker. Par exemple, total_gross_margin utilise la mise en forme Looker pour deux décimales, et percent_of_total_gross_margin utilise la mise en forme Looker pour les pourcentages avec deux décimales.
Vous pouvez utiliser un caractère barre verticale,|, pour séparer les valeurs de différents champs.
Vous pouvez également ajouter d'autres mots qui pourraient clarifier la signification des autres valeurs affichées dans l'info-bulle. Dans ce cas, of total est ajouté pour clarifier la signification de la valeur de pourcentage.
Enregistrez, validez et déployez votre code en production une fois que vous vous êtes assuré qu'il fonctionne comme prévu.
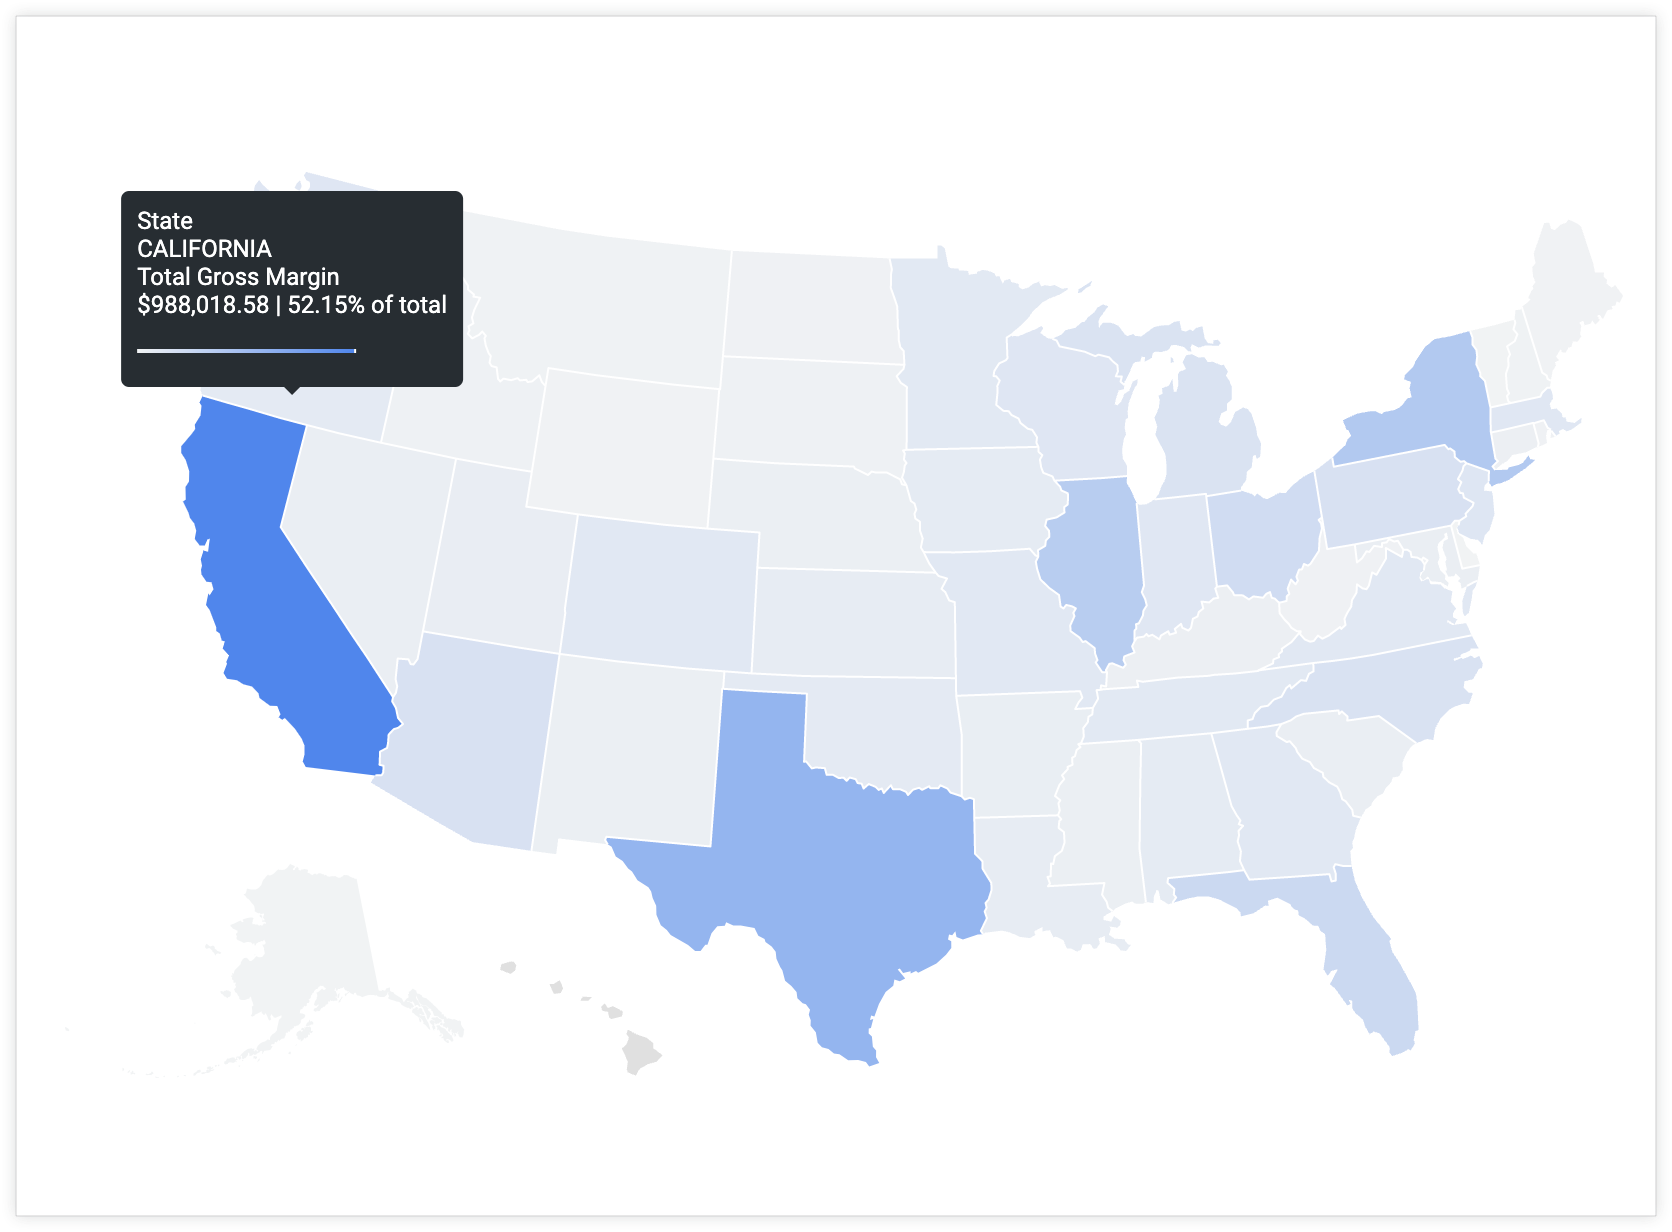
L'info-bulle affiche désormais deux valeurs lorsqu'un utilisateur pointe sur un point de données: la valeur total_gross_margin du point de données et la valeur percent_of_total_gross_margin correspondante.
Étapes suivantes
Une fois que vous avez créé votre visualisation avec une info-bulle personnalisée, vous pouvez la partager avec d'autres utilisateurs:
Sauf indication contraire, le contenu de cette page est régi par une licence Creative Commons Attribution 4.0, et les échantillons de code sont régis par une licence Apache 2.0. Pour en savoir plus, consultez les Règles du site Google Developers. Java est une marque déposée d'Oracle et/ou de ses sociétés affiliées.
Dernière mise à jour le 2025/07/31 (UTC).
[[["Facile à comprendre","easyToUnderstand","thumb-up"],["J'ai pu résoudre mon problème","solvedMyProblem","thumb-up"],["Autre","otherUp","thumb-up"]],[["Difficile à comprendre","hardToUnderstand","thumb-down"],["Informations ou exemple de code incorrects","incorrectInformationOrSampleCode","thumb-down"],["Il n'y a pas l'information/les exemples dont j'ai besoin","missingTheInformationSamplesINeed","thumb-down"],["Problème de traduction","translationIssue","thumb-down"],["Autre","otherDown","thumb-down"]],["Dernière mise à jour le 2025/07/31 (UTC)."],[],[],null,["# Getting the most out of Looker visualizations cookbook: Tooltip customization\n\n| **Note:** This page is part of the [Looker cookbook: Getting the most out of Looker visualizations](/looker/docs/best-practices/cookbook-visualizations-in-looker).\n| **Tip:** Starting in Looker 24.0, you can use the [Chart Config Editor](/looker/docs/chart-config-editor#customize_tooltip_color) to further customize tooltip style and color.\n\nThe [visualization tooltip](/looker/docs/creating-visualizations#the_visualization_tooltip) displays the value of the selected dimensions and measures by default and can help users understand the significance of a single point of data.\n\nFor example, a tooltip for a map visualization that is based on **Total Gross Margin** grouped by **State** will display values for both fields when a user hovers over the state of California.\n\nHowever, what if you want to include fields *other* than the default in the tooltip so that users can get more information or context about a datapoint without needing to look elsewhere?\n\nYou can customize the tooltip to display values from multiple specified fields --- including fields that are not in the Explore query.\n| **Caution:** HTML formatting only renders in [table](/looker/docs/table-options), [table (legacy)](/looker/docs/legacy-table-options), and [single value](/looker/docs/single-value-options) chart visualizations and in visualization tooltips when multiple fields are combined. Any interactive content that is placed in a [map chart's](/looker/docs/map-options#viewing_map_charts_in_the_new_dashboard_experience) tooltip with the `html` parameter will not be accessible on dashboards that use the [new dashboard experience](/looker/docs/viewing-dashboards), although the content will be accessible on Looks and Explores.\n\nIngredients\n-----------\n\n- [Liquid variables](/looker/docs/liquid-variable-reference) --- Liquid variables render the values of other fields in conjunction with the existing Explore query.\n- [`html` parameter](/looker/docs/reference/param-field-html) --- The fields that are defined in the `html` parameter of a measure will render in the tooltip when a user hovers over a visualization.\n- Visualization --- The tooltip will appear when a user hovers their cursor over a datapoint in certain visualization types.\n - [Cartesian charts](/looker/docs/visualization-guide#cartesian_charts)\n - [Pie or donut charts](/looker/docs/visualization-guide#pie_and_donut_charts)\n - [Progression charts](/looker/docs/visualization-guide#progression_charts)\n - [Map charts](/looker/docs/visualization-guide#maps)\n\nPrerequisites\n-------------\n\nCustomizing the tooltip requires the following:\n\n- Permissions to [create Explores](/looker/docs/admin-panel-users-roles#explore) and permissions to [develop LookML](/looker/docs/admin-panel-users-roles#develop).\n- Knowledge of SQL and LookML development.\n- A basic knowledge of using Liquid in Looker and HTML coding. Visit the [Using Liquid variables in the `html` parameter](/looker/docs/reference/param-field-html#using_liquid_variables_in_the_html_parameter) section of the [`html`](/looker/docs/reference/param-field-html) documentation page for necessary background information.\n- Permissions to [save content](/looker/docs/admin-panel-users-roles#save_content) (if you want to save the visualization as a Look or a dashboard)\n\nConsiderations for tooltip customization\n----------------------------------------\n\nIt is important to consider the following when you're customizing a tooltip:\n\n- The values in the `html` parameter become the y-axis of a visualization.\n- The value that you want to display on the y-axis should be the value in the `sql` parameter of the measure.\n- When you're using any formatted measure (a measure of `type: percent_of_total` or a measure with a `value_format_name` or `value_format` parameter), make sure to use the Liquid syntax for the rendered value `{{ field_name._rendered_value }}` (where `field_name` is the actual name of the measure or dimension).\n\nExample\n-------\n\n| **Note:** The example in this section extrapolates upon the example map **Total Gross Margin** grouped by **State** introduced earlier on this page.\n\nBy default, the tooltip for the visualization data points will include the values for **Total Gross Margin** and **State** . However, what if you wanted to provide users with additional information that is not indicated on the map or included in the Explore query? What if you wanted to include the value for a field called **Percent of Total Gross Margin** instead of **State** ? Including **Percent of Total Gross Margin** will help users understand how the **Total Gross Margin** value for an individual data point compares to the total gross margin across the data set.\n\nTo customize the tooltip, follow these steps: \n\n measure: total_gross_margin {\n type: sum\n value_format_name: decimal_2\n sql: ${gross_margin} ;;\n html: {{ rendered_value }} | {{percent_of_gross_margin._rendered_value }} of total ;;\n }\n\n1. In [**Development Mode**](/looker/docs/dev-mode-prod-mode#development_mode), navigate to the LookML definition for the field that you want to customize.\n\n You can navigate directly to a field's LookML definition [from an Explore](/looker/docs/creating-and-editing-explores#features_for_developers).\n2. Determine the fields and values that you want to include in the tooltip in addition to the original field. For example, **Percent of Total Gross Margin**.\n\n3. Add an `html` parameter to the original measure that is referenced in the Explore query and displayed in the tooltip. In this case, the measure that is currently in the Explore query and displayed in the tooltip is **Total Gross Margin**.\n\n4. In the `html` parameter, create an expression with Liquid variables that appends the additional fields to the existing measure's value.\n\n - This example uses the Liquid variable `_rendered_value` to display [Looker formatted values](/looker/docs/reference/param-field-value-format-name). For example, `total_gross_margin` uses Looker formatting for two decimals, and `percent_of_total_gross_margin` uses Looker formatting for percentage with two decimals.\n - You can use a pipe character,`|`, to separate the values for different fields.\n - You can also append other words that might clarify the meaning of the other values that are rendered in the tooltip. In this case, `of total` is added to clarify what the percentage value means.\n5. Save, validate, and push your code to production after verifying that it works as expected.\n\n| **Note:** The input of the `html` parameter only impacts how the value is rendered to users. It does *not* change the underlying value in the database.\n\nThe tooltip will now display two values when a user hovers over a data point with the tooltip: the `total_gross_margin` value of the data point, and the corresponding `percent_of_total_gross_margin` value.\n\nNext steps\n----------\n\nOnce you have created your visualization with a customized tooltip, you can share it with others:\n\n- [Save your Explore as a Look](/looker/docs/saving-and-editing-looks)\n- [Add the Explore to a dashboard](/looker/docs/creating-user-defined-dashboards#adding_query_tiles_from_an_explore)\n- [Share the Explore with a URL](/looker/docs/sharing-urls)"]]