Embedded within query jobs, BigQuery includes diagnostic query
plan and timing information. This is similar to the information provided by
statements such as EXPLAIN in other database and analytical systems. This
information can be retrieved from the API responses of methods such as
jobs.get.
For long running queries, BigQuery will periodically update these statistics. These updates happen independently of the rate at which the job status is polled, but typically won't happen more frequently than every 30 seconds. Additionally, query jobs that don't use execution resources, such as dry run requests or results that can be served from cached results, won't include the additional diagnostic information, though other statistics may be present.
Background
When BigQuery executes a query job, it converts the declarative SQL statement into a graph of execution, broken up into a series of query stages, which themselves are composed of more granular sets of execution steps. BigQuery leverages a heavily distributed parallel architecture to run these queries. Stages model the units of work that many potential workers may execute in parallel. Stages communicate with one another by using a fast distributed shuffle architecture.
Within the query plan, the terms work units and workers are used to convey
information specifically about parallelism. Elsewhere within
BigQuery, you may encounter the term slot, which is an
abstracted representation of multiple facets of query execution, including
compute, memory, and I/O resources. Top level job statistics provide the
estimate of individual query cost using the totalSlotMs estimate of the query
using this abstracted accounting.
Another important property of the query execution architecture is that it is dynamic, which means the query plan can be modified while a query is running. Stages that are introduced while a query is running are often used to improve data distribution throughout query workers. In query plans where this occurs, these stages are typically labeled as Repartition stages.
In addition to the query plan, query jobs also expose a timeline of execution, which provides an accounting of units of work completed, pending, and active within query workers. A query can have multiple stages with active workers simultaneously, and the timeline is intended to show overall progress of the query.
Viewing information with the Google Cloud console
In the Google Cloud console, you can see details of the query plan for a completed query by clicking the Execution Details button (near the Results button).
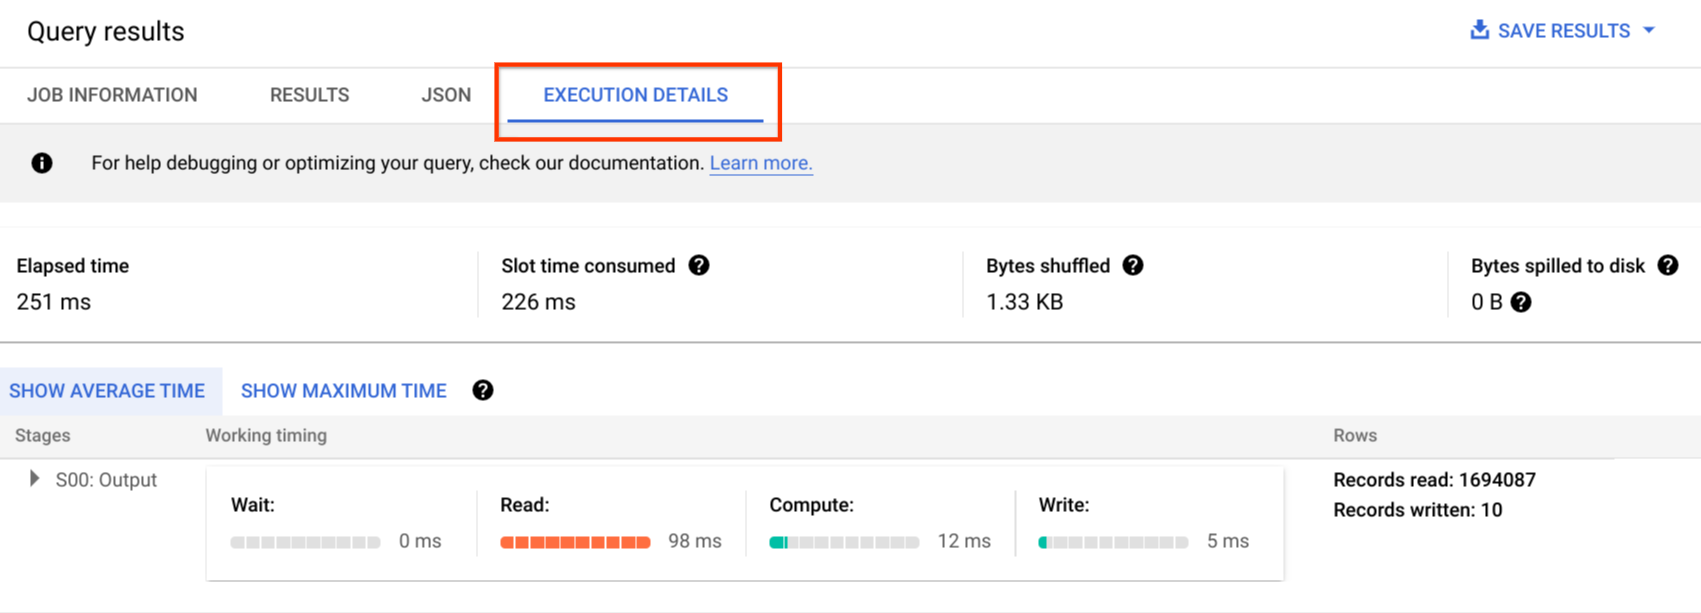
Query plan information
Within the API response, query plans are represented as a list of query stages. Each item in the list shows per-stage overview statistics, detailed step information, and stage timing classifications. Not all details are rendered within the Google Cloud console, but they can all be present within the API responses.
Stage overview
The overview fields for each stage can include the following:
| API field | Description |
|---|---|
id |
Unique numeric ID for the stage. |
name |
Simple summary name for the stage. The steps within the stage provide additional details about execution steps. |
status |
Execution status of the stage. Possible states include PENDING, RUNNING, COMPLETE, FAILED, and CANCELLED. |
inputStages |
A list of the IDs that form the dependency graph of the stage. For example, a JOIN stage often needs two dependent stages that prepare the data on the left and right side of the JOIN relationship. |
startMs |
Timestamp, in epoch milliseconds, that represents when the first worker within the stage began execution. |
endMs |
Timestamp, in epoch milliseconds, that represents when the last worker completed execution. |
steps |
More detailed list of execution steps within the stage. See next section for more information. |
recordsRead |
Input size of the stage as number of records, across all stage workers. |
recordsWritten |
Output size of the stage as number of records, across all stage workers. |
parallelInputs |
Number of parallelizable units of work for the stage. Depending on the stage and query, this may represent the number of columnar segments within a table, or the number of partitions within an intermediate shuffle. |
completedParallelInputs |
Number of units work within the stage that were completed. For some queries, not all inputs within a stage need to be completed for the stage to complete. |
shuffleOutputBytes |
Represents the total bytes written across all workers within a query stage. |
shuffleOutputBytesSpilled |
Queries that transmit significant data between stages may need to fallback to disk-based transmission. The spilled bytes statistic communicates how much data was spilled to disk. Depends on an optimization algorithm so it is not deterministic for any given query. |
Per-stage timing classification
The query stages provide stage timing classifications, in both relative and absolute form. As each stage of execution represents work undertaken by one or more independent workers, information is provided in both average and worst-case times. These times represent the average performance for all workers in a stage as well as the long-tail slowest worker performance for a given classification. The average and max times are furthermore broken down into absolute and relative representations. For ratio-based statistics, the data is provided as a fraction of the longest time spent by any worker in any segment.
The Google Cloud console presents stage timing using the relative timing representations.
The stage timing information is reported as follows:
| Relative timing | Absolute timing | Ratio numerator |
|---|---|---|
waitRatioAvg |
waitMsAvg |
Time the average worker spent waiting to be scheduled. |
waitRatioMax |
waitMsMax |
Time the slowest worker spent waiting to be scheduled. |
readRatioAvg |
readMsAvg |
Time the average worker spent reading input data. |
readRatioMax |
readMsMax |
Time the slowest worker spent reading input data. |
computeRatioAvg |
computeMsAvg |
Time the average worker spent CPU bound. |
computeRatioMax |
computeMsMax |
Time the slowest worker spent CPU bound. |
writeRatioAvg |
writeMsAvg |
Time the average worker spent writing output data. |
writeRatioMax |
writeMsMax |
Time the slowest worker spent writing output data. |
Step overview
Steps contain the operations that each worker within a stage executes, presented as an ordered list of operations. Each step operation has a category, with some operations providing more detailed information. The operation categories present in the query plan include the following:
| Step category | Description |
|---|---|
READ |
A read of one or more columns from an input table or from intermediate shuffle. Only the first sixteen columns that are read are returned in the step details. |
WRITE |
A write of one or more columns to an output table or to intermediate shuffle. For HASH partitioned outputs from a stage, this also includes the columns used as the partition key. |
COMPUTE |
Expression evaluation and SQL functions. |
FILTER |
Used by WHERE, OMIT IF, and HAVING clauses. |
SORT |
ORDER BY operation that includes the column keys and the sort order. |
AGGREGATE |
Implements aggregations for clauses like GROUP BY or COUNT, among others. |
LIMIT |
Implements the LIMIT clause. |
JOIN |
Implements joins for clauses like JOIN, among others; includes the join type and possibly the join conditions. |
ANALYTIC_FUNCTION |
An invocation of a window function (also known as an "analytic function"). |
USER_DEFINED_FUNCTION |
An invocation to a user-defined function. |
Understand step details
BigQuery provides Step details that explain what each step did within a stage. Understanding the steps in a stage is necessary for identifying the source of query performance issues.
To find the step details for a stage, follow these steps:
In the Query results pane, click Execution graph.
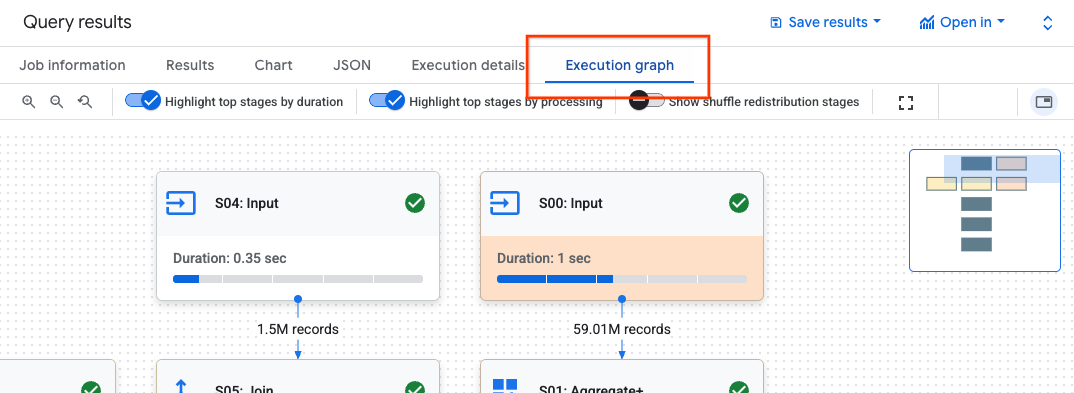
Click the stage that you are interested in to open a panel with stage information.
In the panel with stage information, go to the Step details section.
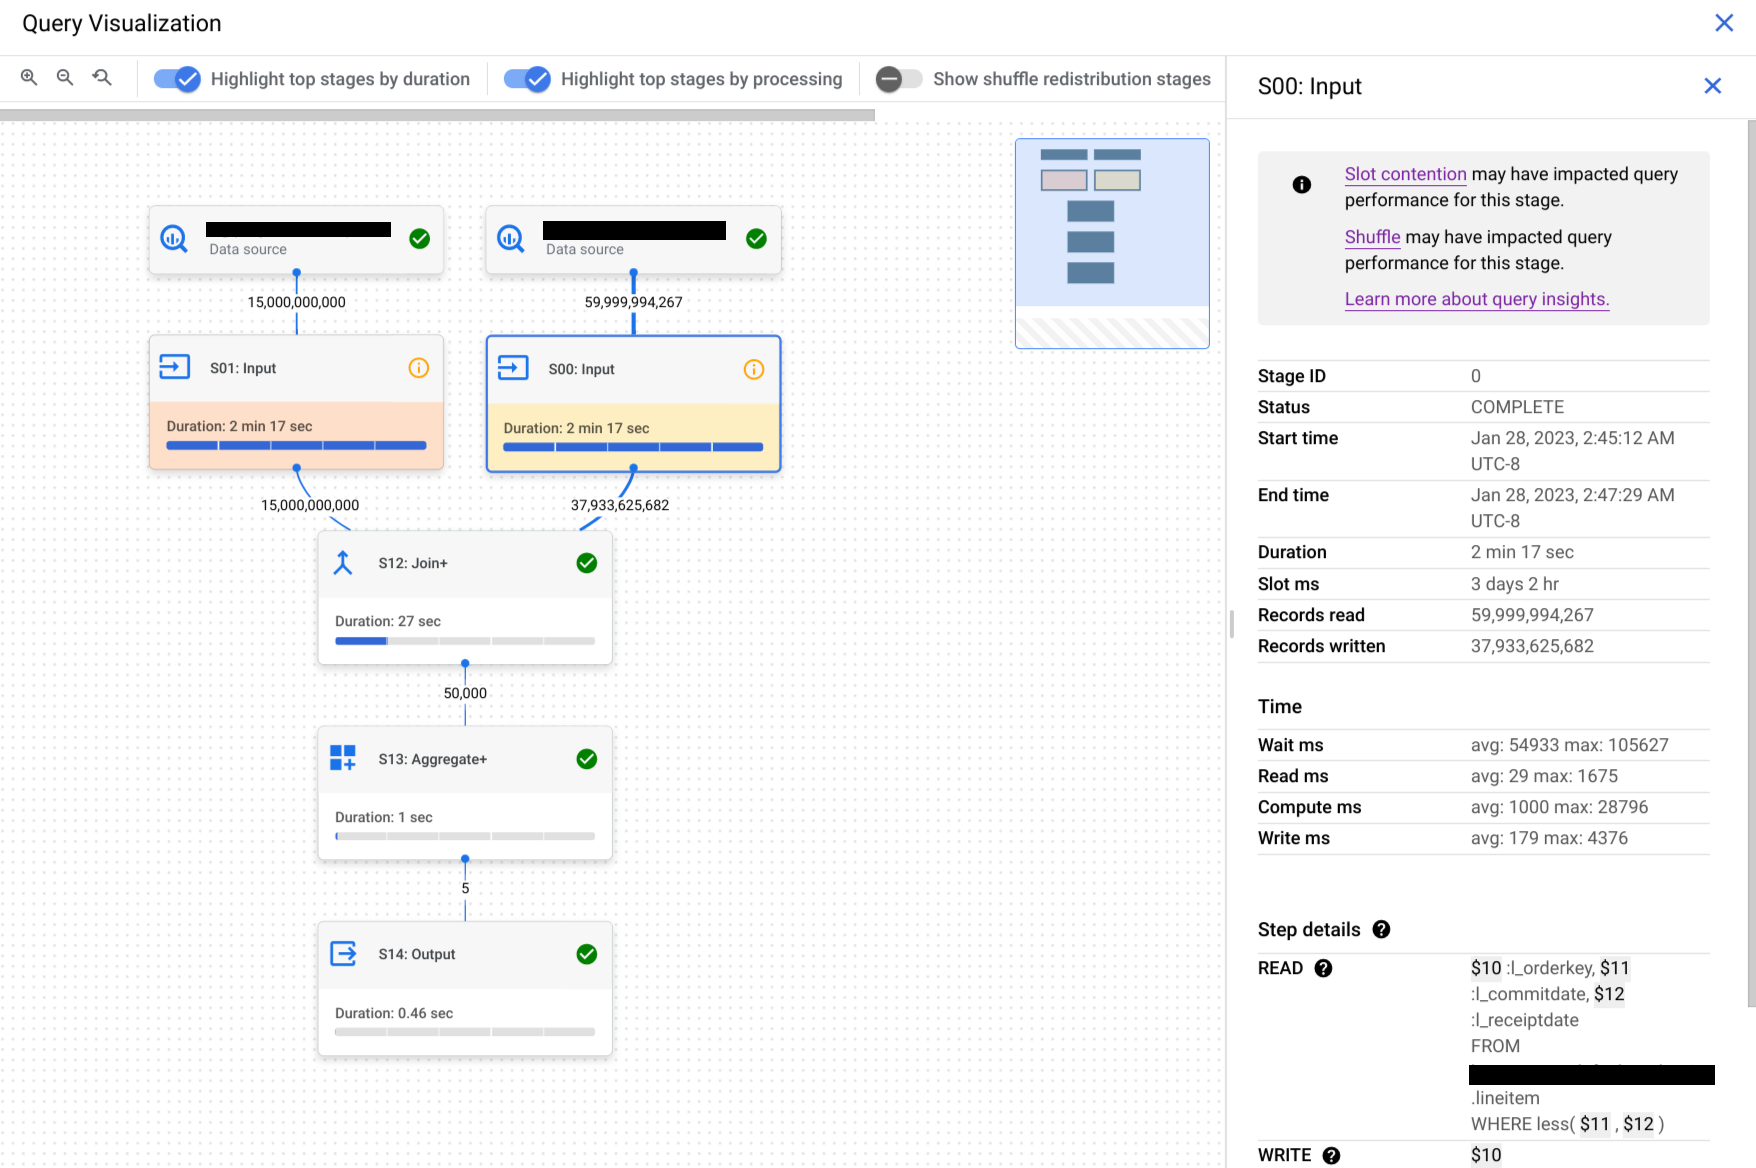
Each step consists of substeps that describe what the step did. Substeps use variables to describe the relationships between steps. Variables begin with a dollar sign followed by a unique number.
Here is an example of step details of a stage with variables shared between steps:
READ
$30:l_orderkey, $31:l_quantity
FROM lineitem

AGGREGATE
GROUP BY $100 := $30
$70 := SUM($31)

WRITE
$100, $70
TO __stage00_output
BY HASH($100)
The example's step details do the following:
The stage read the columns
l_orderkeyandl_quantityfrom the tablelineitemusing variables$30and$31, respectively.The stage aggregated on the variables
$30and$31, storing aggregations into the variables$100and$70, respectively.The stage wrote the results of the variables
$100and$70to shuffle. The stage used$100to order the results of the stage in shuffle.
BigQuery might truncate step details when the query's execution graph was complex enough that providing complete stage step details would cause payload size issues when retrieving query information.
Understand steps with Query text
For support during the preview, email bq-query-inspector-feedback@google.com.
Understanding how the stage's steps are related to the query can be challenging. The Query text section shows how some steps relate to the original query text.
The Query text section highlights different parts of the original query text and shows the steps that map back to the query text immediately preceding the highlighted, original query text. Only the steps immediately above a highlighted part of the original query text apply to the highlighted query text.

The screenshot example shows these mappings:
The step
AGGREGATE: GROUP BY $100 := $30maps back to the query textselect l_orderkey.The step
READ: FROM lineitemmaps back to the query textselect ... from lineitem.The step
AGGREGATE: $70 := SUM($31)maps back to the query textsum(l_quantity).
Not all steps can be mapped back to the query text.
If a query uses views, and if the stage's steps have mappings to a view's query
text, the Query text section shows the view name and view's query text with
their mappings. However, if the view is deleted, or if you
lose the bigquery.tables.get IAM permission
to the view, then the Query text section does not show the stage steps'
mappings for the view.
Interpret and optimize steps
The following sections explain how to interpret the steps in a query plan and provide ways to optimize your queries.
READ step
The READ step means that a stage is accessing data for processing. Data can be
read directly from the tables referenced in a query, or from shuffle memory.
When data from a previous stage is read, BigQuery reads data from
shuffle memory. The amount of data scanned impacts cost when using on-demand
slots and affects performance when using reservations.
Potential performance issues
- Large scan of unpartitioned table: if the query only needs a small portion of the data, then this might indicate that a table scan is inefficient. Partitioning could be a good optimization strategy.
- Scan of a large table with a small filter ratio: this suggests that the filter isn't effectively reducing the data scanned. Consider revising the filter conditions.
- Shuffle bytes spilled over to disk: this suggests that the data isn't stored effectively using optimization techniques such as clustering, which could maintain similar data in clusters.
Optimize
- Targeted filtering: use
WHEREclauses strategically to filter out irrelevant data as early as possible in the query. This reduces the amount of data that needs to be processed by the query. - Partitioning and clustering: BigQuery uses table
partitioning and clustering to efficiently locate specific data segments.
Ensure your tables are partitioned and clustered based on your typical query
patterns to minimize data scanned during
READsteps. - Select relevant columns: avoid using
SELECT *statements. Instead, select specific columns or useSELECT * EXCEPTto avoid reading unnecessary data. - Materialized views: materialized views can precompute and store
frequently used aggregations, potentially reducing the need to read base
tables during
READsteps for queries that use those views.
COMPUTE step
In the COMPUTE step, BigQuery performs the following actions on
your data:
- Evaluates expressions in the query's
SELECT,WHERE,HAVING, and other clauses, including calculations, comparisons, and logical operations. - Executes built-in SQL functions and user-defined functions.
- Filters rows of data based on conditions in the query.
Optimize
The query plan can reveal bottlenecks within the COMPUTE step. Look for stages
with extensive computations or a high number of rows processed.
- Correlate the
COMPUTEstep with data volume: if a stage shows significant computation and processes a large volume of data, then it might be a good candidate for optimization. - Skewed data: for stages where the compute maximum is significantly higher than the compute average, this indicates that the stage spent a disproportionate amount of time processing a few slices of data. Consider looking at the distribution of data to see if there is data skew.
- Consider data types: use appropriate data types for your columns. For example, using integers, datetimes, and timestamps instead of strings can improve performance.
WRITE step
WRITE steps happen for intermediate data and final output.
- Writing to shuffle memory: in a multi-stage query, the
WRITEstep often involves sending the processed data to another stage for further processing. This is typical for shuffle memory, which combines or aggregates data from multiple sources. The data written during this stage is typically an intermediate result, not the final output. - Final output: the query result is written to either the destination or a temporary table.
Hash Partitioning
When a stage in the query plan writes data to a hash partitioned output, BigQuery writes the columns included in the output and the column chosen as the partition key.
Optimize
While the WRITE step itself might not be directly optimized, understanding its
role can help you identify potential bottlenecks in earlier stages:
- Minimize data written: focus on optimizing preceding stages with filtering and aggregation to reduce the amount of data written during this step.
Partitioning: writing benefits greatly from table partitioning. If the data that you write is confined to specific partitions, then BigQuery can perform faster writes.
If the DML statement has a
WHEREclause with a static condition against a table partition column, then BigQuery only modifies the relevant table partitions.Denormalization trade-offs: denormalization can sometimes lead to smaller result sets in intermediate
WRITEstep. However, there are drawbacks such as increased storage usage and data consistency challenges.
JOIN step
In the JOIN step, BigQuery combines data from two data sources.
Joins can include join conditions. Joins are resource intensive. When joining
large data in BigQuery, the join keys are shuffled independently
to line up on the same slot, so that the join is performed locally on each slot.
The query plan for the JOIN step typically reveals the following details:
- Join pattern: this indicates the type of join used. Each type defines how many rows from the joined tables are included in the result set.
- Join columns: these are the columns used to match rows between the sources of data. The choice of columns is crucial for join performance.
Join patterns
- Broadcast join: when one table, typically the smaller one, can fit in
memory on a single worker node or slot, BigQuery can
broadcast it to all other nodes to perform the join efficiently. Look for
JOIN EACH WITH ALLin the step details. - Hash join: when tables are large or a broadcast join isn't suitable, a
hash join might be used. BigQuery uses hash and shuffle
operations to shuffle the left and right tables so that the matching keys
end up in the same slot to perform a local join. Hash joins are an expensive
operation since the data needs to be moved, but they enable efficient
matching of rows across hashes. Look for
JOIN EACH WITH EACHin the step details. - Self join: a SQL antipattern in which a table is joined to itself.
- Cross join: a SQL antipattern that can cause significant performance issues because it generates larger output data than the inputs.
- Skewed join: the data distribution across the join key in one table is very skewed and can lead to performance issues. Look for cases where the max compute time is much greater than the average compute time in the query plan. For more information, see High cardinality join and Partition skew.
Debugging
- Large data volume: if the query plan shows a significant amount of data
processed during the
JOINstep, investigate the join condition and join keys. Consider filtering or using more selective join keys. - Skewed data distribution: analyze the data distribution of join keys. If one table is very skewed, explore strategies such as splitting the query or prefiltering.
- High cardinality joins: joins that produce significantly more rows than the number of left and right input rows can drastically reduce query performance. Avoid joins that produce a very large number of rows.
- Incorrect ordering of table: Ensure you've chosen the appropriate join
type, such as
INNERorLEFT, and ordered tables from largest to smallest based on your query's requirements.
Optimize
- Selective join keys: for join keys, use
INT64instead ofSTRINGwhen possible.STRINGcomparisons are slower thanINT64comparisons because they compare each character in a string. Integers only require a single comparison. - Filter before joining: apply
WHEREclause filters on individual tables before the join. This reduces the amount of data involved in the join operation. - Avoid functions on join columns: avoid calling functions on join columns. Instead, standardize your table data during the ingestion or post-ingestion process using ELT SQL pipelines. This approach eliminates the need to modify join columns dynamically, which enables more efficient joins without compromising data integrity.
- Avoid self joins: self-joins are commonly used to compute row-dependent relationships. However, self-joins can potentially quadruple the number of output rows, leading to performance issues. Instead of relying on self-joins, consider using window (analytic) functions.
- Large tables first: even though the SQL query optimizer can determine which table should be on which side of the join, order your joined tables appropriately. The best practice is to place the largest table first, followed by the smallest, and then by decreasing size.
- Denormalization: in some cases, strategically denormalizing tables (adding redundant data) can eliminate joins altogether. However, this approach comes with storage and data consistency trade-offs.
- Partitioning and clustering: partitioning tables based on join keys and clustering colocated data can significantly speed up joins by letting BigQuery target relevant data partitions.
- Optimizing skewed joins: to avoid performance issues associated with skewed joins, pre-filter data from the table as early as possible or split the query into two or more queries.
AGGREGATE step
In the AGGREGATE step, BigQuery aggregates and groups data.
Debugging
- Stage details: check the number of input rows to and output rows from the aggregation, and the shuffle size to determine how much data reduction the aggregate step achieved and whether data shuffling was involved.
- Shuffle size: a large shuffle size might indicate that a significant amount of data was moved across worker nodes during the aggregation.
- Check data distribution: ensure the data is evenly distributed across partitions. Skewed data distribution can lead to imbalanced workloads in the aggregate step.
- Review aggregations: analyze the aggregation clauses to confirm they are necessary and efficient.
Optimize
- Clustering: cluster your tables on columns frequently used in
GROUP BY,COUNT, or other aggregation clauses. - Partitioning: choose a partitioning strategy that aligns with your query patterns. Consider using ingestion-time partitioned tables to reduce the amount of data scanned during the aggregation.
- Aggregate earlier: if possible, perform aggregations earlier in the query pipeline. This can reduce the amount of data that needs to be processed during the aggregation.
- Shuffling optimization: if shuffling is a bottleneck, explore ways to minimize it. For example, denormalize tables or use clustering to colocate relevant data.
Edge cases
- DISTINCT aggregates: queries with
DISTINCTaggregates can be computationally expensive, especially on large datasets. Consider alternatives likeAPPROX_COUNT_DISTINCTfor approximate results. - Large number of groups: if the query produces a vast number of groups, it might consume a substantial amount of memory. In such cases, think about limiting the number of groups or using a different aggregation strategy.
REPARTITION step
Both REPARTITION and COALESCE are optimization techniques that
BigQuery applies directly to the shuffled data in the query.
REPARTITION: this operation aims to rebalance data distribution across worker nodes. Suppose that after shuffling, one worker node ends up with a disproportionately large amount of data. TheREPARTITIONstep redistributes the data more evenly, preventing any single worker from becoming a bottleneck. This is particularly important for computationally intensive operations like joins.COALESCE: this step happens when you have many small buckets of data after shuffling. TheCOALESCEstep combines these buckets into larger ones, reducing the overhead associated with managing numerous small pieces of data. This can be especially beneficial when dealing with very small intermediate result sets.
If you see REPARTITION or COALESCE steps in your query plan, it doesn't
necessarily mean there's a problem with your query. It's often a sign that
BigQuery is proactively optimizing data distribution for better
performance. However, if you see these operations repeatedly, it might indicate
that your data is inherently skewed or that your query is causing excessive data
shuffling.
Optimize
To reduce the number of REPARTITION steps, try the following:
- Data distribution: ensure that your tables are partitioned and clustered effectively. Well-distributed data reduces the likelihood of significant imbalances after shuffling.
- Query structure: analyze the query for potential sources of data skew. For example, are there highly selective filters or joins that result in a small subset of data being processed on a single worker?
- Join strategies: experiment with different join strategies to see if they lead to a more balanced data distribution.
To reduce the number of COALESCE steps, try the following:
- Aggregation strategies: consider performing aggregations earlier in the
query pipeline. This can help reduce the number of small intermediate result
sets that might cause
COALESCEsteps. - Data volume: if you're dealing with very small datasets,
COALESCEmight not be a significant concern.
Don't over-optimize. Premature optimization might make your queries more complex without yielding significant benefits.
Explanation for federated queries
Federated queries let you send a query
statement to an external data source by using the EXTERNAL_QUERY
function.
Federated queries are subject to the optimization technique known as SQL
pushdowns and the query
plan shows operations pushed down to the external data source, if any. For
example, if you run the following query:
SELECT id, name
FROM EXTERNAL_QUERY("<connection>", "SELECT * FROM company")
WHERE country_code IN ('ee', 'hu') AND name like '%TV%'
The query plan will show the following stage steps:
$1:id, $2:name, $3:country_code
FROM table_for_external_query_$_0(
  SELECT id, name, country_code
  FROM (
    /*native_query*/
    SELECT * FROM company
  )
  WHERE in(country_code, 'ee', 'hu')
)
WHERE and(in($3, 'ee', 'hu'), like($2, '%TV%'))
$1, $2
TO __stage00_output
In this plan, table_for_external_query_$_0(...) represents the
EXTERNAL_QUERY function. In the parentheses you can see the query that the
external data source executes. Based on that, you can notice that:
- An external data source returns only 3 selected columns.
- An external data source returns only rows for which
country_codeis either'ee'or'hu'. - The
LIKEoperator is not push down and is evaluated by BigQuery.
For comparison, if there are no pushdowns, the query plan will show the following stage steps:
$1:id, $2:name, $3:country_code
FROM table_for_external_query_$_0(
  SELECT id, name, description, country_code, primary_address, secondary address
  FROM (
    /*native_query*/
    SELECT * FROM company
  )
)
WHERE and(in($3, 'ee', 'hu'), like($2, '%TV%'))
$1, $2
TO __stage00_output
This time an external data source returns all the columns and all the rows from
the company table and BigQuery performs filtering.
Timeline metadata
The query timeline reports progress at specific points in time, providing snapshot views of overall query progress. The timeline is represented as a series of samples that report the following details:
| Field | Description |
|---|---|
elapsedMs |
Milliseconds elapsed since the start of query execution. |
totalSlotMs |
A cumulative representation of the slot milliseconds used by the query. |
pendingUnits |
Total units of work scheduled and waiting for execution. |
activeUnits |
Total active units of work being processed by workers. |
completedUnits |
Total units of work that have been completed while executing this query. |
An example query
The following query counts the number of rows in the Shakespeare public dataset and has a second conditional count that restricts results to rows that reference 'hamlet':
SELECT
  COUNT(1) as rowcount,
  COUNTIF(corpus = 'hamlet') as rowcount_hamlet
FROM `publicdata.samples.shakespeare`
Click Execution details to see the query plan:
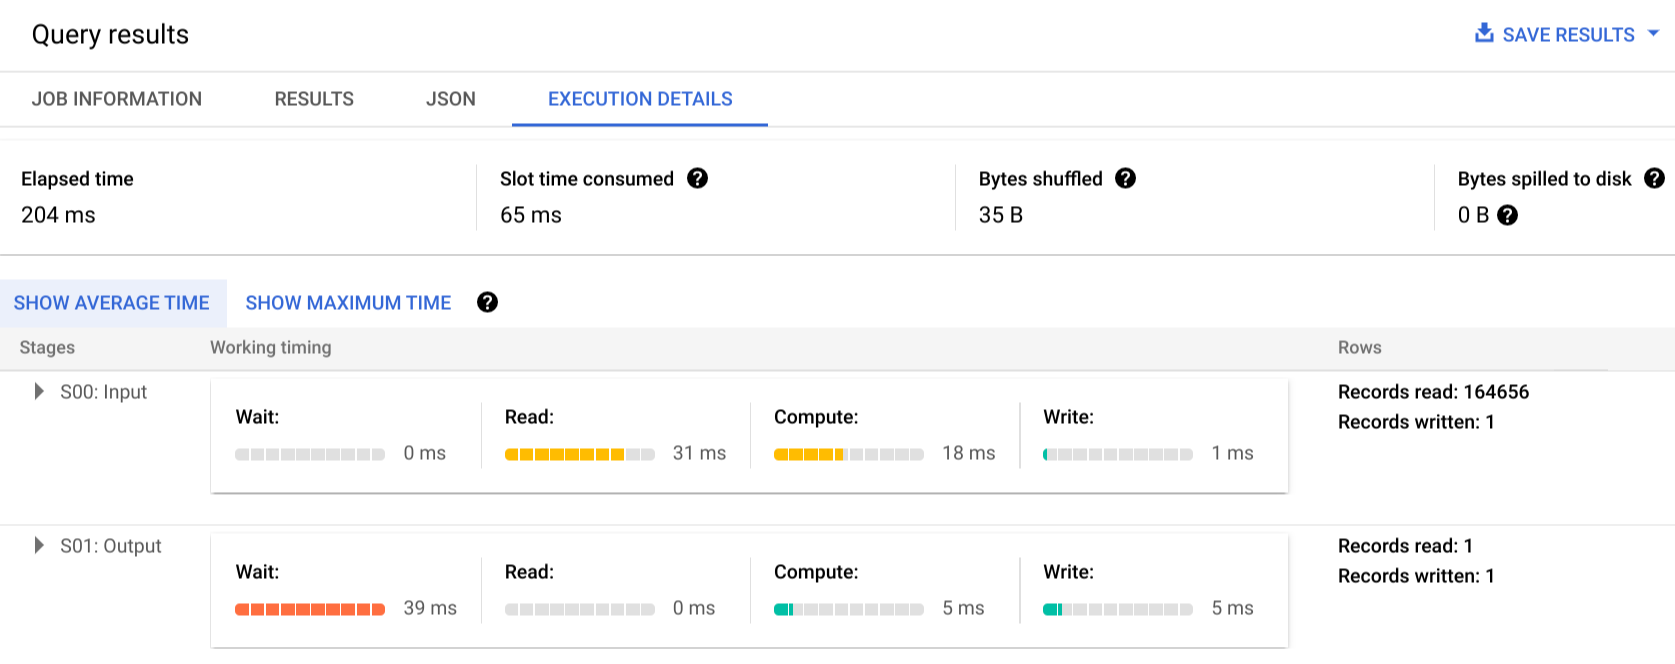
The color indicators show the relative timings for all steps across all stages.
To learn more about the steps of the execution stages, click to expand the details for the stage:
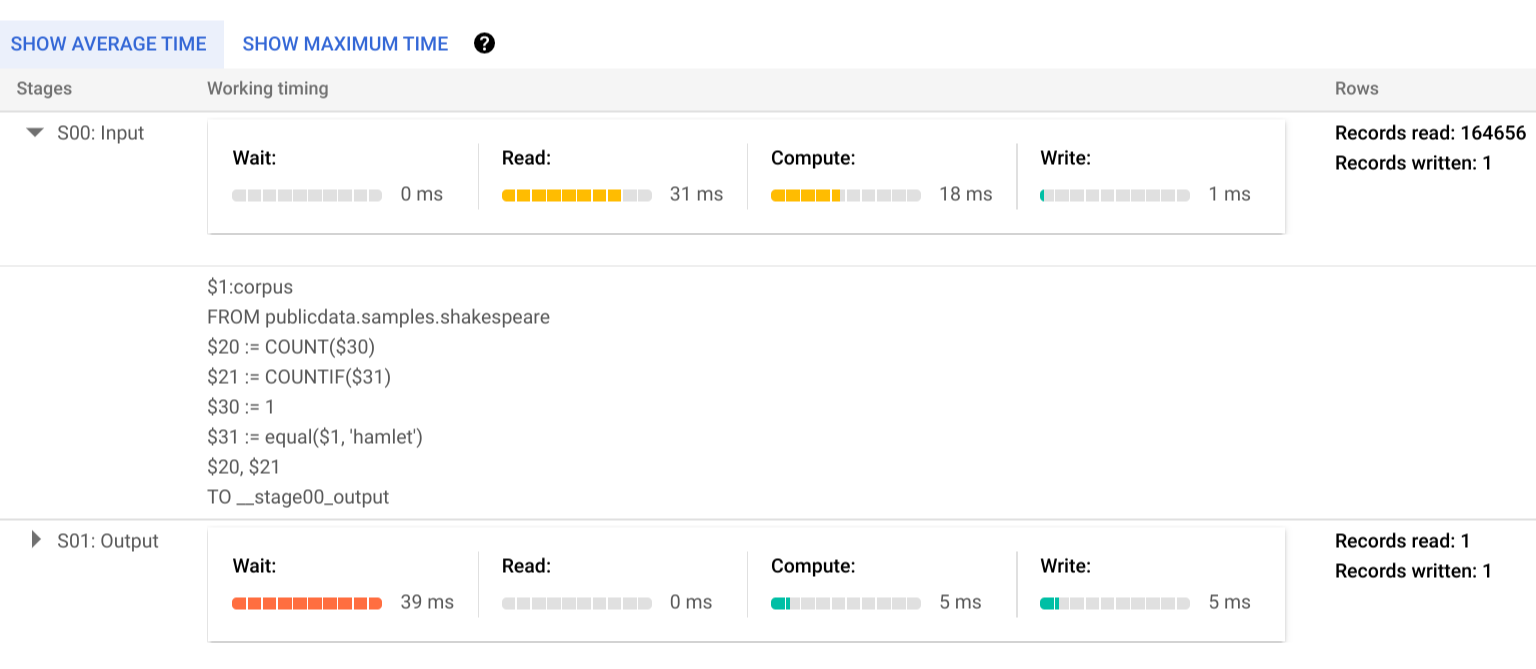
In this example, the longest time in any segment was the time the single worker in Stage 01 spent waiting for Stage 00 to complete. This is because Stage 01 was dependent on Stage 00's input, and couldn't start until the first stage wrote its output into intermediate shuffle.
Error reporting
It is possible for query jobs to fail mid-execution. Because plan information is updated periodically, you can observe where within the execution graph the failure occurred. Within the Google Cloud console, successful or failed stages are labeled with a checkmark or exclamation point next to the stage name.
For more information about interpreting and addressing errors, see the troubleshooting guide.
API sample representation
Query plan information is embedded in the job response information, and you can
retrieve it by calling jobs.get.
For example, the following excerpt of a JSON response for a job returning the
sample hamlet query shows both the query plan and timeline information.
"statistics": {
  "creationTime": "1576544129234",
  "startTime": "1576544129348",
  "endTime": "1576544129681",
  "totalBytesProcessed": "2464625",
  "query": {
    "queryPlan": [
      {
        "name": "S00: Input",
        "id": "0",
        "startMs": "1576544129436",
        "endMs": "1576544129465",
        "waitRatioAvg": 0.04,
        "waitMsAvg": "1",
        "waitRatioMax": 0.04,
        "waitMsMax": "1",
        "readRatioAvg": 0.32,
        "readMsAvg": "8",
        "readRatioMax": 0.32,
        "readMsMax": "8",
        "computeRatioAvg": 1,
        "computeMsAvg": "25",
        "computeRatioMax": 1,
        "computeMsMax": "25",
        "writeRatioAvg": 0.08,
        "writeMsAvg": "2",
        "writeRatioMax": 0.08,
        "writeMsMax": "2",
        "shuffleOutputBytes": "18",
        "shuffleOutputBytesSpilled": "0",
        "recordsRead": "164656",
        "recordsWritten": "1",
        "parallelInputs": "1",
        "completedParallelInputs": "1",
        "status": "COMPLETE",
        "steps": [
          {
            "kind": "READ",
            "substeps": [
              "$1:corpus",
              "FROM publicdata.samples.shakespeare"
            ]
          },
          {
            "kind": "AGGREGATE",
            "substeps": [
              "$20 := COUNT($30)",
              "$21 := COUNTIF($31)"
            ]
          },
          {
            "kind": "COMPUTE",
            "substeps": [
              "$30 := 1",
              "$31 := equal($1, 'hamlet')"
            ]
          },
          {
            "kind": "WRITE",
            "substeps": [
              "$20, $21",
              "TO __stage00_output"
            ]
          }
        ]
      },
      {
        "name": "S01: Output",
        "id": "1",
        "startMs": "1576544129465",
        "endMs": "1576544129480",
        "inputStages": [
          "0"
        ],
        "waitRatioAvg": 0.44,
        "waitMsAvg": "11",
        "waitRatioMax": 0.44,
        "waitMsMax": "11",
        "readRatioAvg": 0,
        "readMsAvg": "0",
        "readRatioMax": 0,
        "readMsMax": "0",
        "computeRatioAvg": 0.2,
        "computeMsAvg": "5",
        "computeRatioMax": 0.2,
        "computeMsMax": "5",
        "writeRatioAvg": 0.16,
        "writeMsAvg": "4",
        "writeRatioMax": 0.16,
        "writeMsMax": "4",
        "shuffleOutputBytes": "17",
        "shuffleOutputBytesSpilled": "0",
        "recordsRead": "1",
        "recordsWritten": "1",
        "parallelInputs": "1",
        "completedParallelInputs": "1",
        "status": "COMPLETE",
        "steps": [
          {
            "kind": "READ",
            "substeps": [
              "$20, $21",
              "FROM __stage00_output"
            ]
          },
          {
            "kind": "AGGREGATE",
            "substeps": [
              "$10 := SUM_OF_COUNTS($20)",
              "$11 := SUM_OF_COUNTS($21)"
            ]
          },
          {
            "kind": "WRITE",
            "substeps": [
              "$10, $11",
              "TO __stage01_output"
            ]
          }
        ]
      }
    ],
    "estimatedBytesProcessed": "2464625",
    "timeline": [
      {
        "elapsedMs": "304",
        "totalSlotMs": "50",
        "pendingUnits": "0",
        "completedUnits": "2"
      }
    ],
    "totalPartitionsProcessed": "0",
    "totalBytesProcessed": "2464625",
    "totalBytesBilled": "10485760",
    "billingTier": 1,
    "totalSlotMs": "50",
    "cacheHit": false,
    "referencedTables": [
      {
        "projectId": "publicdata",
        "datasetId": "samples",
        "tableId": "shakespeare"
      }
    ],
    "statementType": "SELECT"
  },
  "totalSlotMs": "50"
},
Using execution information
BigQuery query plans provide information about how the service executes queries, but the managed nature of the service limits whether some details are directly actionable. Many optimizations happen automatically by using the service, which can differ from other environments where tuning, provisioning, and monitoring can require dedicated, knowledgeable staff.
For specific techniques that can improve query execution and performance, see the best practices documentation. The query plan and timeline statistics can help you understand whether certain stages dominate resource utilization. For example, a JOIN stage that generates far more output rows than input rows can indicate an opportunity to filter earlier in the query.
Additionally, timeline information can help identify whether a given query is slow in isolation or due to effects from other queries contending for the same resources. If you observe that the number of active units remains limited throughout the lifetime of the query but the amount of queued units of work remains high, this can represent cases where reducing the number of concurrent queries can significantly improve overall execution time for certain queries.
