Monitor and view logs for BigQuery Data Transfer Service
BigQuery Data Transfer Service monitoring and logging provide information about the service's workload performance and status. BigQuery Data Transfer Service exports monitoring data to Cloud Monitoring.
Monitor BigQuery Data Transfer Service
You can use monitoring metrics for the following purposes:
- Evaluate the usage and performance a data transfer configuration.
- Troubleshoot problems.
- Monitor transfer run statuses.
To create custom dashboards, set up alerts, and query metrics with Monitoring, you can use the Google Cloud console or the Monitoring API.
View transfer data in Metrics Explorer
In the Google Cloud console, go to the Monitoring page.
In the navigation pane, click Metrics Explorer.
Select your project.
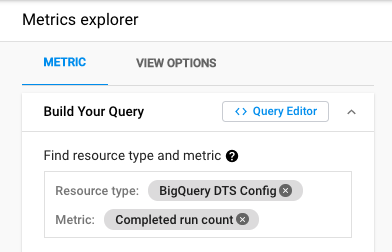
In the Find resource type and metric box, enter the following:
- For Resource type, enter
BigQuery DTS Config. For Metric, select one of the metrics listed in Monitoring metrics for transfer configurations, for example,
Completed run count.
- For Resource type, enter
Optional: Select aligner, reducer, and other parameters.
The metrics are displayed in the Metrics explorer window.

Define Cloud Monitoring alerts
You can define Monitoring alerts for BigQuery Data Transfer Service metrics:
In the Google Cloud console, go to the Monitoring page.
In the navigation pane, select Alerting > Create policy.
For more information about alerting policies and concepts behind them, see Types of alerting policies.
Click Add Condition and select a condition type.
Select metrics and filters. For metrics, the resource type is BigQuery DTS Config.
Click Save Condition.
Enter policy name, and then click Save Policy.
For more information about alerting policies and concepts, see Introduction to alerting.
Define Cloud Monitoring custom dashboards
You can create custom dashboards over BigQuery Data Transfer Service metrics:
In the Google Cloud console, go to the Monitoring page.
In the navigation pane, select Dashboards > Create Dashboard.
Click Add Chart.
Give the chart a title.
Select metrics and filters. For metrics, the resource type is BigQuery DTS Config.
Click Save.
For more information, see Manage custom dashboards.
Metric reporting frequency and retention
Metrics for BigQuery Data Transfer Service runs are exported to Monitoring in batches, at 1-minute intervals. Monitoring data is retained for 6 weeks.
The dashboard provides data analysis in default intervals of 1h (1 hour), 6H
(6 hours), 1D (1 day), 1W (1 week), and 6W (6 weeks). You can manually
request analysis in any interval between 1M (1 minute) to 6W (6 weeks).
Monitor metrics for transfer configurations
The following metrics for BigQuery Data Transfer Service configs are exported to Monitoring:
| Metric | Description |
|---|---|
| Run latency distribution | Distribution of the execution time (in seconds) of each transfer run, per transfer configuration. |
| Active run count | Number of transfer runs that are running or pending, per transfer configuration. |
| Completed run count | Number of completed transfer runs in a time period, per transfer configuration. |
Filter dimensions for metrics
Metrics are aggregated for each BigQuery Data Transfer Service configuration. You can filter aggregated metrics by the following dimensions:
| Property | Description |
|---|---|
TRANSFER_STATE |
Represents the current transfer state of the transfer run. This dimension can have one of the following values:
|
ERROR_CODE |
Represents the final error code of the transfer run. This dimension can have one of the following values:
|
RUN_CAUSE |
Represents how a transfer run was triggered. This dimension can have one of the following values:
|
BigQuery Data Transfer Service logs
Each BigQuery Data Transfer Service run is logged using Cloud Logging. Logging is automatically enabled for all data transfers.
Required roles
The Logs Viewer role (roles/logging.viewer) gives you read-only access to all
features of Logging. For more information about the
Identity and Access Management (IAM) permissions and roles that apply to
Logging data, see the Logging access control
guide.
View logs
To view logs, go to the Logs Explorer page.
BigQuery Data Transfer Service logs are indexed first by the transfer configuration and then by the individual transfer run.
View transfer run logs
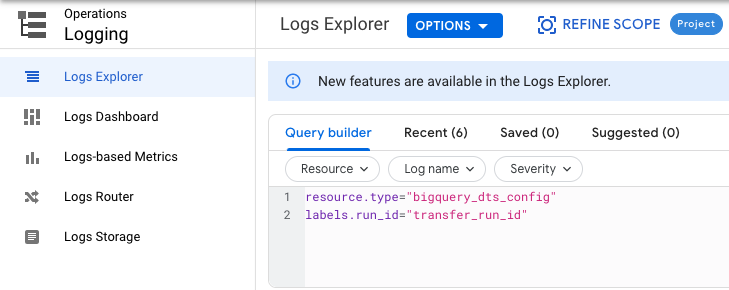
To show only the log entries from a given transfer run_id, in the Query
builder, add the following filters:
resource.type="bigquery_dts_config"
labels.run_id="transfer_run_id"

View transfer configuration logs
To show log entries from a given transfer config_id, in the Query builder,
add the following filters:
resource.type="bigquery_dts_config"
resource.labels.config_id="transfer_config_id"
View all logs
To see all BigQuery Data Transfer Service logs, do one of the following:
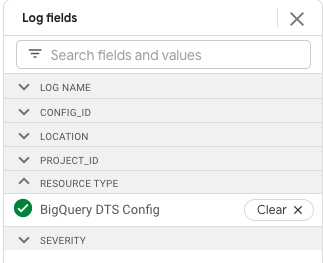
In the Fields pane, for Resource type, select BigQuery DTS Config.

In the Query builder, add the following filter:
resource.type="bigquery_dts_config"
For more information about how to use the Log Explorer, see Using the Log Explorer.
Log format
BigQuery Data Transfer Service logs messages in the following format:
{
  "insertId": "0000000000",
  "jsonPayload": {
    "message": "DTS transfer run message."
  },
  "resource": {
    "type": "bigquery_dts_config",
    "labels": {
      "project_id": "my_project_id",
      "config_id": "transfer_config_id",
      "location": "us"
    }
  },
  "timestamp": "2020-11-25T04:45:48.545732221Z",
  "severity": "INFO",
  "labels": {
    "run_id": "transfer_run_id"
  },
  "logName": "projects/your_project_id/logs/bigquerydatatransfer.googleapis.com%2Ftransfer_config",
  "receiveTimestamp": "2020-11-25T04:45:48.960214929Z"
}
What is logged
BigQuery Data Transfer Service log entries contain information that is useful for monitoring and debugging your transfer runs. Log entries contain the following types of information:
timestamp: used to compute the log entry's age and to enforce the log's retention periodseverity: can beINFO,WARNINGorERRORmessage_text: holds a string that explains the current status of the transfer run
What's next
- Learn more about Monitoring.
- Read an overview of Cloud Audit Logs and Cloud Logging.
