注意:在 Looker 22.14 中,map_layer 参数添加了对 GeoJSON 文件的支持。
Looker 包含多个内置地图图层,但您也可以定义自定义地图区域来显示地理数据。假设您有以下三个社区的平均年龄表格:
| 客户邻域 | 客户平均年龄 |
|---|---|
| 市中心 | 19.5292 |
| eastside | 54.4626 |
| Westside | 34.9534 |
您可能需要将客户邻域映射到特定地理区域,以便在地图上直观呈现。为此,请按照本页中所述的步骤操作。
准备地区数据
如需准备地区数据,您需要一个数据文件,其中包含每个地区的地理形状,还包含将该地区与数据库中的数据相关联的元数据。
Looker 使用一种名为 TopoJSON 的格式以紧凑的方式存储此类数据。您可以使用许多常见的 Shapefile 格式轻松创建 TopoJSON 文件,也可以使用在线工具自行绘制 TopoJSON 文件,如 将 Shapefile 转换为 TopoJSON 社区帖子中所详述。
在本例中,我们已经准备好了提供此映射的 TopoJSON 文件。TopoJSON 文件中的每个区域都有一个名为 neighborhood 的属性,该属性与“客户邻域”字段的值相匹配,该字段在 LookML 项目中定义为名为 neighborhood 的维度。
上传地区数据
如需将区域数据导入 Looker,您可以将 TopoJSON 文件拖放到项目的文件浏览器部分。这些数据将与 LookML 代码一起提交,并像 LookML 项目中的任何其他代码一样进行更新。
创建地图图层
现在,您已在项目中添加了地区数据,接下来需要在 LookML 模型中创建地图图层。
您可以使用 map_layer 参数在模型文件中添加定义:
map_layer: my_neighborhood_layer {
  file: "neighborhoods.topojson"
  property_key: "neighborhood"
}
file 参数引用项目中包含地区数据的文件的名称,property_key 是您要在 Looker 中公开的数据集的属性。如果您不确定键是什么,只需省略媒体资源键,Looker 会尝试选择适当的键。
提示:您还可以使用托管在其他在线位置的 TopoJSON 文件,只需在图层定义中指定url而不是file即可:
map_layer: my_neighborhood_layer {
  url: "https://raw.githubusercontent.com/cooluser/JSON_Stuff/master/Neighborhoods.topoJSON"
  property_key: "neighborhood"
}
将地图图层与数据相关联
接下来只需通过应用 map_layer_name 参数将视图中的维度 neighborhood 与新创建的地图图层相关联即可。
dimension: neighborhood {
  sql: ${TABLE}.neighborhood ;;
  map_layer_name: my_neighborhood_layer
}
这会告知 Looker 此维度的值与地图图层公开的 property_key 相关联。它还会告知 Looker 可以在地图上显示此类数据。
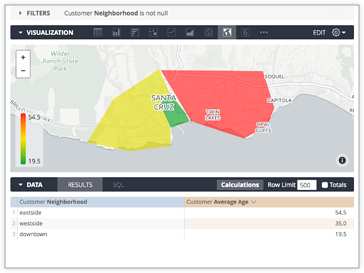
查看地图
现在,使用 neighborhood 维度的查询可以在“探索”页面中显示在地图上: