如果您具備建立資料表計算的權限,就可以使用快捷計算,針對 Explore 資料表中的數值欄位執行常見計算作業,而無須使用 Looker 函式和運算子。
有時您或其他使用者可能會想分析探索中的樞資料。本頁說明如何使用 pivot_row() 表格計算函式建立列總和其他匯總,協助使用者進一步瞭解「探索」資料。
pivot_row() 的運作方式為何?
pivot_row() 資料表計算函式會將樞紐資料列的所有值分組成清單。
本範例使用下列探索資料表,其中「產品數量」以「訂單建立日期」分組,並以「使用者年齡」樞紐:
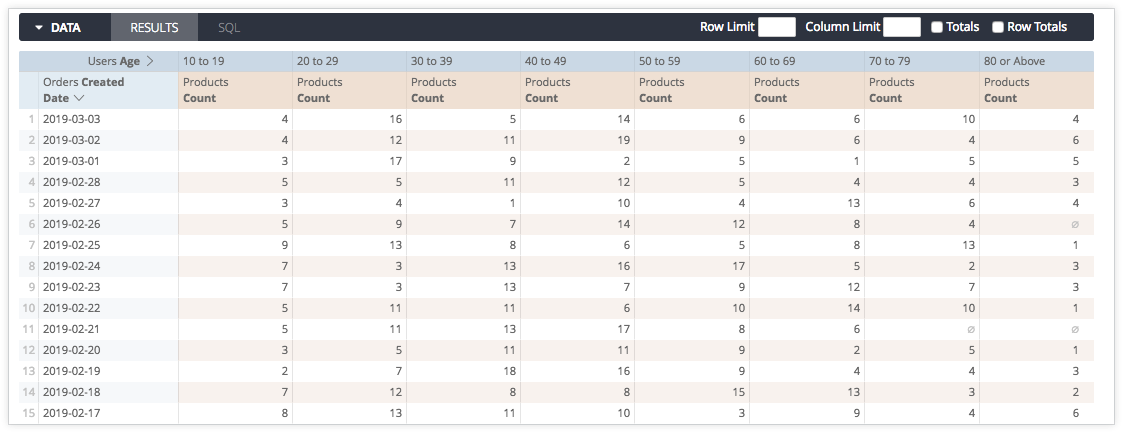
您可以使用 pivot_row() 編寫資料表計算,將所有「Products Count」資料列值分組到一個資料欄:
pivot_row(${products.count})
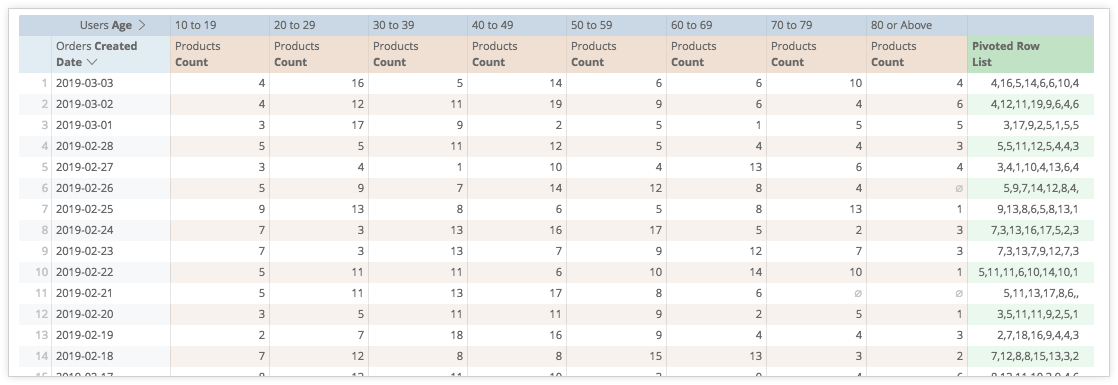
接著,表格計算會輸出新資料欄,其中會顯示每個透視資料列中 Products Count 的所有值清單:
使用 pivot_row() 計算資料列總和
您也可以對使用 pivot_row() 函式建立的清單執行運算,進一步進行分析。舉例來說,您可以對 pivot_row() 傳回的清單值使用 sum() 函式,計算資料列的總和。
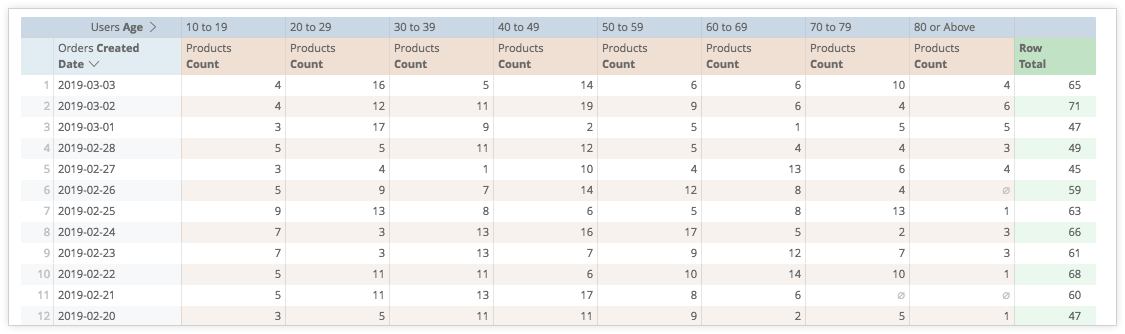
使用相同的探索資料表,其中「Products Count」以「Orders Created Date」做為分組依據,並以「Users Age」做為樞紐,您可以編寫下列表格計算,輸出「Products Count」的資料列總和:
sum(pivot_row(${products.count}))
表格運算會將使用 pivot_row() 函式計算的「產品數量」值清單加總,並輸出新欄,顯示每個已切換的資料列的總和:
使用 pivot_row() 計算其他匯總
您可以使用 pivot_row() 函式匯總任何樞紐資料列。舉例來說,您可以計算清單中 sum() 以外的值的 mean()、max()、min() 等。Looker 函式和運算子說明文件頁面中的這個部分會列出所有可用的表格計算函式和運算子。
pivot_row() 函式,在資料透視表的資料列中執行更複雜的計算,包括總百分比。如要瞭解如何使用 pivot_row() 計算各列的總百分比,請參閱如何計算總百分比最佳做法頁面。