Resource-based committed use discounts (CUD) are available exclusively for Compute Engine and provide a discount in exchange for your commitment to use a minimum level of Compute Engine resources in a particular region. The discount applies to vCPUs, memory, GPUs, and local SSDs.
Committed use discounts for Compute Engine offer deep discounts on VM usage in exchange for a 1 or 3 year commitment. Upon purchase, you are billed a monthly fee for the duration of the term you selected, whether or not you use the services. The discounts you earn can be significant and CUD are recommended if your workload is stable and predictable.
The committed use discount analysis report helps you to visualize and understand the effectiveness and financial impact of the committed use discounts you have purchased. Using the CUD analysis report, you can now analyze your Compute Engine resource usage alongside your commitments to answer questions such as:
- How much are my committed use discounts saving me on my bill?
- Am I fully utilizing my existing commitments?
- How much of my eligible usage is covered by commitments?
- Is there an opportunity to save more by increasing my commitments?
- Can I improve my commitment utilization by enabling discount sharing?
Required permissions
To view the CUD analysis report for all projects in your
Cloud Billing account, you need to be a Billing Account Administrator or
Billing Account Viewer. Specifically, you need the
billing.accounts.getSpendingInformation permission on your
Cloud Billing account.
The permissions that you need to view the CUD analysis differ from those you need to view the Cloud Billing reports. Project Owners, Project Editors, and Project Viewers can view Cloud Billing reports for their specific projects, but these roles do not grant permission to view the CUD Analysis for their specific projects by default.
For more information about Cloud Billing permissions, see:
- Overview of Access Control
- Create Custom Roles for Cloud Billing
- Understanding Predefined IAM Roles for Cloud Billing
Access the analysis report
To view the CUD analysis for your Cloud Billing account:
In the Google Cloud console, go to the CUD analysis page.
At the prompt, choose the Cloud Billing account that you want to view.
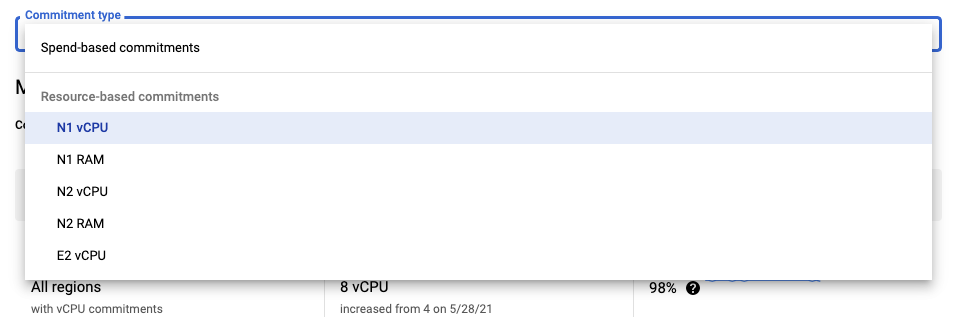
From the Commitment type menu, select Resource-based commitments, then select the resource-based commitment that you want to analyze, such as N2 vCPU.
Information in the CUD analysis report
The committed use discount analysis page shows the details of the selected commitment for the granularity and time period specified in the filter. The analysis also includes summary cards, a stacked bar chart, and a summary table of the commitment's totals.
Summary cards
Above the stacked bar chart, there are three summary cards.
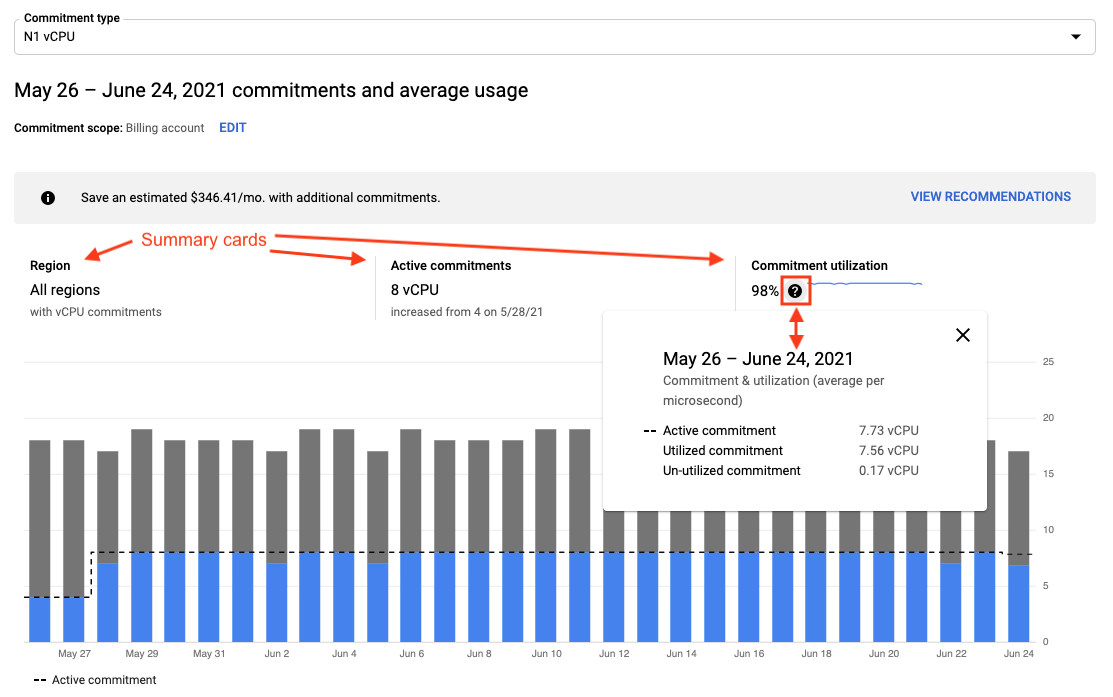
The summary cards display:
Region: Identifies the region for which the usage commitments and utilization data is displayed.
- If you are viewing the report in aggregate, this will be a single report for All regions or for the number of regions selected in the filter (for example, 4 filtered regions).
- If you are viewing your report by region, you will see one report for each region you select to analyze (for example, us-central1).
Active commitments: The current quantity of commitments you have purchased for the given set of filters you select.
Commitment utilization: The percentage (%) of your usage commitments that you have consumed, based on the current set of filters over the time range selected. To view additional details, hover your pointer over the help tooltip next to the percentage.
Stacked bar chart
Below the summary cards is a stacked bar chart that shows:
- Daily average quantities of commitment-covered usage (lower part of the bar, using a color other than gray). This usage earns committed use discount credits.
- Additional, eligible on-demand usage (gray-colored section of the bar). This usage is charged at the standard, non-discounted, usage rate.
Active commitment is your pre-purchased commitment quantity (dashed line). Indicates your daily quantity of purchased commitment for each day displayed.
To understand the monthly cost of your active commitment, see the Commitment cost on the Cost Breakdown report.
To view details for an individual day, including usage amounts, utilization, and coverage for that day, hover your pointer over the bar for that day.
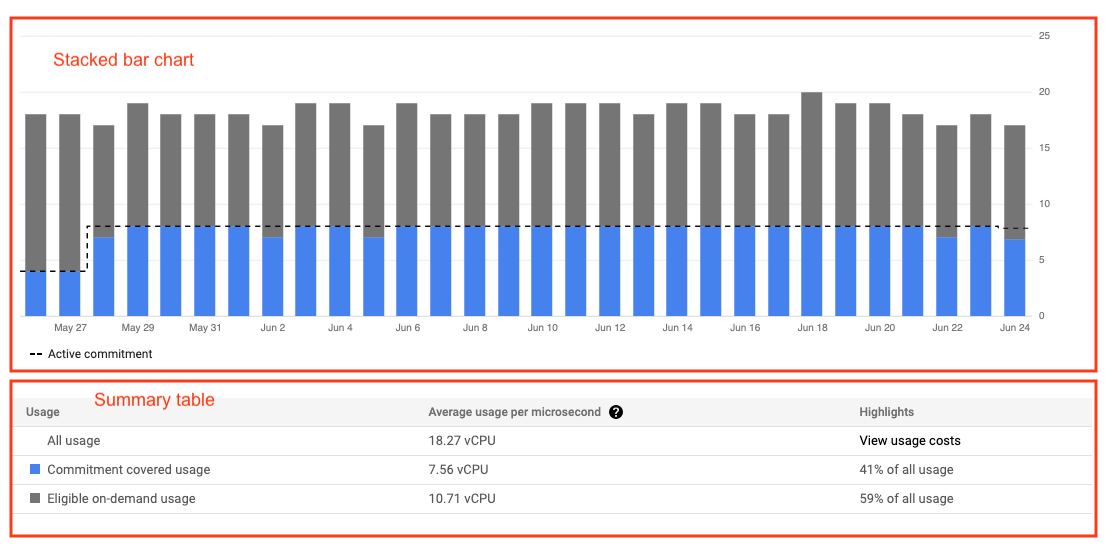
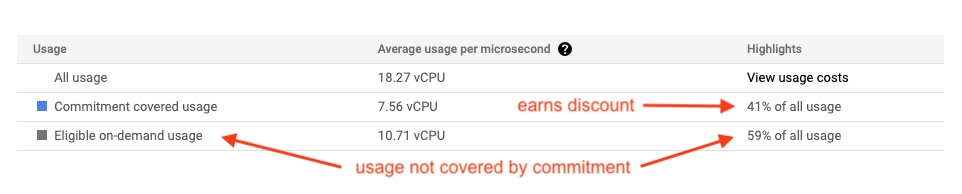
Summary table
Below the stacked bar chart is the summary table, displaying aggregate quantities for the selected filters across the entire time range being shown.
To view your usage cost details, click View usage costs in the Highlights column to access the Cloud Billing reports.
Analyze your commitments
Choose the commitment type
Commitments are applied separately for each type of resource. Above the chart, select the commitment type you want to view from the menu (for example, vCPU, RAM, or Local SSD). In your report, you will see menu items for any of your usage that is eligible for CUD, even if you haven't purchased a commitment of that type.
Adjust scope and granularity
Use filters to adjust the view and scope of usage and commitments that is displayed in the chart(s).
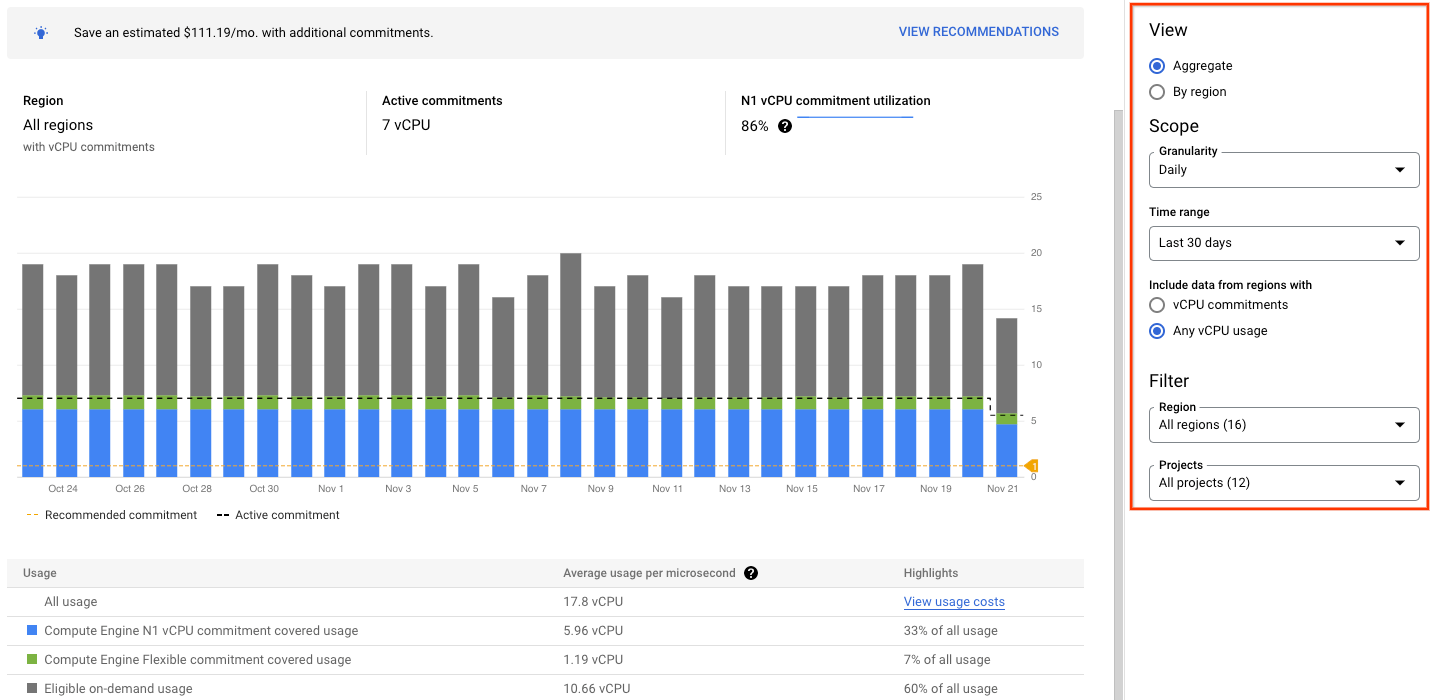
View
Commitments are purchased separately for each individual region and project. Select the type of chart view you want to see.
Aggregate: The aggregate view produces a single chart for the commitment type selected and is a high-level view of how your CUD are performing across all regions and projects selected.
By region: This view produces one chart for each region for the commitment type selected, helping you to assess CUD utilization and coverage separately. You might need to scroll the reports view to see each chart. The number of charts that are produced depends on the regions and projects selected.
If you select By region, you can set Sort by options from the following:
- Commitment Level (High > Low) (default): Displays one chart per region, starting with the region with the highest commitment quantity purchased to the region with the lowest commitment quantity purchased.
- Usage (High > Low): Displays one chart per region, starting with the region with the highest overall usage to the region with the lowest overall usage.
- Alphabetical (A > Z): Displays the charts in alphabetical order based on region name.
Scope
Granularity: You can choose to see your data with hourly or daily granularity.
Time range: When granularity is set to Daily, you can select a preset or custom time range to view and analyze your usage data and covered commitments. The default time range is Last 30 days.
When granularity is set to Hourly, the date range to view hourly data is limited to three days.
Include data from regions with: The options available here depend on the commitment type selected in the report (such as vCPU, RAM, or Local SSD).
Examples:
If you select the vCPU commitment type, you will see:
- vCPU commitments: Produces one chart for each region (or one aggregated chart) where you purchased vCPU commitments. Excludes regions where no vCPU commitments were purchased.
- Any vCPU usage: Produces one chart for each region (or one aggregated chart) where you incurred vCPU usage. This includes regions with vCPU usage where no vCPU commitments were purchased.
If you select the RAM commitment type, you will see:
- RAM commitments: Produces one chart for each region (or one aggregated chart) where you purchased RAM commitments. Excludes regions where no RAM commitments were purchased.
- Any RAM usage: Produces one chart for each region (or one aggregated chart) where you incurred RAM usage. This includes regions with RAM usage where no RAM commitments were purchased.
Filter
Region: Select All (default), many, or one region for the report.
Project: Select All (default), many, or one project for the report.
For either filter:
- If you set your report view to Aggregate, you will see a single chart for the commitment type, aggregated by the selected regions and projects.
- If you set your report view to By region, you will see one chart for each selected region, aggregated by the selected projects, for the selected commitment type.
Commitment utilization
For any given day:
- If you fully consume your commitment, then your commitment-covered usage and your active commitment is equal, and your commitment utilization is 100%.
- If you did not fully consume your commitment, then your commitment-covered usage is less than your active commitment, and your commitment utilization is less than 100%.
You might underutilize a commitment because:
- Your aggregate average usage on a day is lower than your commitment.
- Your usage varied throughout the day and was lower than your commitment for part of the day.
- Your usage and commitments are in different regions.
- Your usage and commitments are in different projects and you have not enabled discount sharing for your Cloud Billing account.
- Any combination of the previous reasons.
Even if you did not fully consume your commitment, because you receive a large discount on the commitment-covered usage, you might still incur a lower cost overall compared to the same total usage billed at the on-demand rate.
See the Cost Breakdown report to better understand your savings.
View your usage costs details in Billing Reports.
Commitment coverage
If your report shows additional, eligible on-demand usage, this indicates some of your usage was not covered by your active commitment and your discounted commitment-covered usage will be less than 100%.
- If your additional usage comes from stable workloads, this might indicate that you have the opportunity to save additional money by purchasing additional commitments.
- If your additional usage comes from other projects that haven't purchased committed use discounts, you might benefit from enabling discount sharing for your Cloud Billing account.
Analyze per-day usage trends with hourly data granularity
You can adjust the Scope filter to view your commitment usage by daily or hourly granularity.
You can use hourly granularity to analyze:
- Usage patterns throughout the day.
- When during that day you were underutilizing your commitment.
- Fluctuations in daily usage to determine future CUD purchases.
Commitment recommendations
Committed use discount recommendations let you identify VM usage patterns in your Google Cloud projects. Purchasing the recommended commitments helps you optimize your compute costs.
Learn more about how to review, understand, and purchase your Cloud Billing account's committed use discount recommendations.
Discount sharing
If you have multiple projects that share the same Cloud Billing account, we recommend that you enable committed use discount sharing. Sharing your committed use discounts across all your projects reduces the overhead of managing discounts on a per-project basis and pools the eligible resource usage to maximize your discount.
By default, committed use discounts are applied to the project in which they are purchased. If you have several projects, you might not receive the full benefit of your purchased discounts if they're applied to only those specific projects. By turning on committed use discount sharing, all of your projects within that Cloud Billing account share all of the committed use discount contracts. This spreads your savings across your Cloud Billing account and its projects.
Discount sharing applies your commitments across all projects linked to the Cloud Billing account. The discounts and commitment charges are shared across projects based on each project's share of the total eligible usage within the Cloud Billing account. If any portion of a given commitment is not used, the balance of the commitment charge remains in the project that purchased the commitment.
To determine if discount sharing is enabled for your Cloud Billing account, from the top of the report page, select COMMITMENT SCOPE.
- If the Current scope is Project, then discount sharing is not enabled, and the committed use discounts are applied to eligible usage only in the project in which they are purchased.
- If the Current scope is Billing account, then discount sharing is enabled, and the committed use discounts are applied across all eligible usage in all projects linked to this Cloud Billing account.
Attribution for commitments
Attribution refers to how resource benefits shared at the Cloud Billing account level are divided among account-level resources, such as projects. Attribution for a subscription, such as your committed use discount subscription, determines how fees and credits are applied to your Cloud Billing account and spread across the account's projects that are eligible to consume them. This is reflected in how the fees and credits appear in Cloud Billing cost management interfaces, such as the usage cost export or the Google Cloud console.
You can choose to use proportional attribution or prioritized attribution for resource-based commitments. Unless you configure your attribution preferences first, when you enable discount sharing, it defaults to using proportional attribution.
For more information and how to enable each type of attribution for your resource-based committments, see Choose attribution for resource-based commitments.
Example of fully utilized commitments
The following example shows a Cloud Billing account with multiple projects and discount sharing enabled, where the committed use discounts are fully utilized. The Cloud Billing account is linked to three projects (Project-1, Project-2, and Project-3) where Project-1 and Project-2 purchase committed use discounts and Project-3 does not.
The example assumes the projects have the following commitments and N1 Standard VM usage for a day:
| Project-1 | Project-2 | Project-3 | Total | |
|---|---|---|---|---|
| Commitments (cores) | 100 (1yr CUD) | 60 (3yr CUD) | 0 | 160 |
| Usage (cores) | 50 | 40 | 110 | 200 |
In this example, the total commitments purchased are 160 cores and the total VM usage for the Cloud Billing account is 200 cores. Because discount sharing has been enabled for the Cloud Billing account, the charge for the commitment (160 cores) is shared across all three projects based on project usage as a percent of the total Cloud Billing account usage.
| Project-1 | Project-2 | Project-3 | |
|---|---|---|---|
| Usage (cores) | 50 | 40 | 110 |
| Percent of billing account usage | 50 / 200 = 25% | 40 / 200 = 20% | 110 / 200 = 55% |
| Number of unused CUDs | 160 CUDs - 200 usage = 0 unused cores | ||
| Percent of all CUDs covered by usage | 200 usage / 160 CUDs = 100% coverage | ||
| Attribution for 1 yr CUDs covered by usage | 100 * 100% * 25% = 25 units | 100 * 100% * 20% = 20 units | 100 * 100% * 55% = 55 units |
| Attribution for 3 yr CUDs covered by usage | 60 * 100% * 25% = 15 units | 60 * 100% * 20% = 12 units | 60 * 100% * 55% = 33 units |
| Attribution for unused 1 yr CUDs | 0 unused cores * (100 used cores / 160 total cores) = 0 units | N/A | N/A |
| Attribution for unused 3 yr CUDs | N/A | 0 unused cores * (60 used cores / 160 total cores) = 0 units | N/A |
In this example, the cores covered by commitments total 160 (40 + 32 + 88). Since the usage across all three projects totals 200 (50 + 40 + 110), this account's commitments are fully utilized.
The total invoice for the Cloud Billing account (summed across all projects) follows the normal committed use discounts billing format.
- The customer receives a debit for all core usage at the on-demand prices (200 cores running for 24 hours).
- The committed use discount credit partially offsets the 160 cores used by each of the projects linked to the Cloud Billing account, including the one that didn't purchase commitments.
- The monthly commitment debit for 160 cores for 24 hours is charged regardless of utilization.
Detailed billing data for each project is visible in the customer's Cloud Billing reports and Cloud Billing data exports to BigQuery.
Example of underutilized commitments
This example shows a Cloud Billing account with multiple projects and discount sharing enabled, where the committed use discounts purchased are not completely utilized. The Cloud Billing account is linked to three projects (Project-1, Project-2, and Project-3) where Project-1 and Project-2 purchase committed use discounts and Project-3 does not.
The example assumes the projects have the following commitments and N1 Standard VM usage for a day:
| Project-1 | Project-2 | Project-3 | Total | |
|---|---|---|---|---|
| Commitments (cores) | 100 (1yr CUD) | 60 (3yr CUD) | 0 | 160 |
| Usage (cores) | 50 | 40 | 10 | 100 |
In this example, the total commitments purchased are 160 cores and the total VM usage for the Cloud Billing account is 100 cores. Because discount sharing has been enabled for the Cloud Billing account and the commitment is not fully utilized, all cores in each project are covered by the commitments. The remaining unused commitments (60 cores) are charged proportionately to each project that originally purchased the commitments. With remaining unused commitments charged to the projects, the customer is not receiving the full benefit of the committed use discounts they originally purchased.
| Project-1 | Project-2 | Project-3 | |
|---|---|---|---|
| Usage (cores) | 50 | 40 | 10 |
| Percent of billing account usage | 50 / 100 = 50% | 40 / 100 = 40% | 10 / 100 = 10% |
| Number of unused CUDs | 160 CUDs - 100 usage = 60 unused cores | ||
| Percent of all CUDs covered by usage | 100 usage / 160 CUDs = 62.5% coverage | ||
| Attribution for 1 yr CUDs covered by usage | 100 * 62.5% * 50% = 31.25 units | 100 * 62.5% * 40% = 25 units | 100 * 62.5% * 10% = 6.25 units |
| Attribution for 3 yr CUDs covered by usage | 60 * 62.5% * 50% = 18.75 units | 60 * 62.5% * 40% = 15 units | 60 * 62.5% * 10% = 3.75 units |
| Attribution for unused 1 yr CUDs | 60 unused cores * (100 used cores / 160 total cores) = 37.5 units | N/A | N/A |
| Attribution for unused 3 yr CUDs | N/A | 60 unused cores * (60 used cores / 160 total cores) = 22.5 units | N/A |
In this example, the cores covered by commitments total 160 (40 + 32 + 88). However, the usage across all three projects only totals 100 (50 + 40 + 10). Since the total usage is less than the purchased commitments, the commitments are considered under-utilized. Each project will pay for a fixed percentage of 62.5% based on their billing account usage.
All unused commitments are charged to Project-1 and Project-2 based on the original quantity of commitments purchased.
The total invoice for the billing account (summed across all projects) follows the normal committed use discounts billing format.
- The customer receives a debit for all core usage at the on-demand prices (100 cores running for 24 hours).
- The committed use discount credit fully offsets the 100 cores used by each of the projects linked to the Cloud Billing account, including the one that didn't purchase commitments.
- The monthly commitment debit for 160 cores for 24 hours is charged regardless of utilization.
Detailed billing data for each project is visible in the customer's Cloud Billing reports and Cloud Billing data exports to BigQuery.
Attribution when using custom machine type SKUs
With discount sharing, committed use discounts are spread proportionally across all projects, regardless of the mix of SKUs used. If you use Custom Machine Types (CMT) SKUs with discount sharing enabled, SKU-level reporting will be impacted.
Custom machine type SKU usage is more expensive than predefined machine SKUs. To optimize your cost savings, commitment credits are initially applied to custom machine types before predefined. This impacts SKU-level reporting when commitment credits are attributed evenly across all projects linked to a Cloud Billing account based on the total eligible usage (predefined, CMT, or sole-tenant).
When viewing your commitment costs by organizational unit (folder, project, user labels) the commitment charges and credits are evenly distributed. However, if you drill down to the SKU-level reports for a specific project, you might see negative costs for a given SKU due to the higher credits applied to custom machine types. This is intentional and evenly distributes the commitment credit across all projects linked to your Cloud Billing account. You can view accurate SKU-level reporting at the Cloud Billing account level.
Data latency
There is a difference in timing between when your VM usage costs are reported to your Cloud Billing account, and when your commitments and other earned discounts are reported. Your VM usage cost data is reported to your Cloud Billing account multiple times per day. Cloud Billing data for commitment charges, committed use discount credits, and sustained use discount credits can be delayed for up to one-and-a-half days. This difference in timing can cause your most recent costs from the current and previous day to appear higher than expected because the credits to offset those costs are not yet attributed.
As additional usage data arrives during the latency period, the distribution of your discount can be revised multiple times and there can be an increase of usage line items in your Cloud Billing data export to BigQuery dataset.
Related topics
- Learn more about committed use discounts
- Compute Engine: Committed use discounts
- View your Cloud Billing reports and cost trends
- Understand your savings with cost breakdown reports
- Export Cloud Billing data to BigQuery
- View your cost and payment history