Cloud Monitoring
Gain visibility into the performance, availability, and health of your applications and infrastructure.
Get started now with: dashboards, the Ops Agent for VMs, and Managed Service for Prometheus
Built on the same backend used by Google that holds over 65 quadrillion points on disk
Learn how Cloud Monitoring helps customers implement SRE principles to improve their businesses
Stay up-to-date with the latest blogs and resources
Benefits
For Google Cloud and other environments
For Google Cloud and other environments
Cloud Monitoring offers automatic out-of-the-box metric collection dashboards for Google Cloud services. It also supports monitoring of hybrid and multicloud environments.
Identify trends, prevent issues
Identify trends, prevent issues
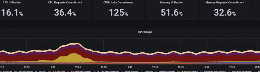
Metrics, events, and metadata are displayed with rich query language that helps identify issues and uncover patterns. Service-level objectives measure user experience and improve collaboration with developers.
Reduce monitoring overhead
Reduce monitoring overhead
One integrated service for metrics, uptime monitoring, dashboards, and alerts reduces time spent navigating between systems. Observability in context makes metrics available within Google Cloud resource pages.
Key features
Key features
SLO monitoring
Automatically infer or custom define service-level objectives (SLOs) for applications and get alerted when SLO violations occur. Check out our step-by-step guide to learn how to set SLOs, following SRE best practices.
Managed metrics collection for Kubernetes and virtual machines
Google Cloud’s operations suite offers Managed Service for Prometheus for use with Kubernetes, which features self-deployed and managed collection options to simplify metrics collection, storage, and querying. For VMs, you can use the Ops Agent, which combines logging and metrics collection into a single agent that can be deployed at scale using popular configuration and management tools.
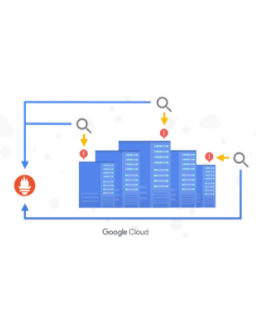
Google Cloud integration
Discover and monitor all Google Cloud resources and services, with no additional instrumentation, integrated right into the Google Cloud console.
Customers
Customers are using Cloud Monitoring to improve their operations

What's new
What's new
Sign up for Google Cloud newsletters to receive product updates, event information, special offers, and more.
Documentation
Documentation
All features
All features
| Synthetic monitoring | Continuously track the performance of your web applications and APIs using automated script based tests. Monitor for faulty behavior such as regressions, broken features, high response times, and unexpected status codes. Create alerts to be notified proactively in case of unexpected behavior. |
| SLO monitoring | Automatically infer or custom define service-level objectives (SLOs) for applications and get alerted when SLO violations occur. |
| Custom metrics | Instrument your application to monitor application and business-level metrics via Cloud Monitoring. |
| Google Cloud Console integration | Discover and monitor all Google Cloud resources and services, with no additional configuration, integrated right into the Google Cloud console. |
| Managed Service for Prometheus | Monitor and alert on your workloads, using Prometheus, without having to manually manage and operate Prometheus at scale. |
| Ops Agent | Deploy the Ops Agent on your Google Cloud VMs to collect detailed metrics and logs from your applications and system. Try the in-console, step-by-step tutorial to experience installing the agent on a live VM. |
| Logging integration | Drill down from dashboards and charts to logs. Create, visualize, and alert on metrics based on log data. |
| Dashboards | Get visibility into your cloud resources and services with no configuration. Define custom dashboards and take advantage of Google’s powerful data visualization tools. |
| Multiple project and group/cluster support | Create metrics scopes to monitor single or multiple projects together, and create resource groups to define relationships based on resource names, tags, security groups, projects, regions, accounts, and other criteria. Use those relationships to create targeted dashboards and topology-aware alerting policies. |
| Alerting | Configure alerting policies to notify you when events occur or particular system or custom metrics violate rules that you define. Use multiple conditions to define complex alerting rules. Receive notifications via email, SMS, Slack, PagerDuty, and more. |
| Uptime monitoring | Monitor the availability of your internet-accessible URLs, VMs, APIs, and load balancers from probes around the globe with uptime checks. Create alerts to be notified proactively if there is an outage. |
Pricing
Pricing
The pricing for Google Cloud Monitoring lets you control your usage and spending. You can use the free data usage allotments to get started with no upfront fees or commitments. Learn more in the pricing details guide.
Feature | Price1 | Free allotment per month | Effective date |
|---|---|---|---|
All Monitoring data except data ingested by using Managed Service for Prometheus | $0.2580/MiB1: first 150–100,000 MiB $0.1510/MiB: next 100,000–250,000 MiB$0.0610/MiB: >250,000 MiB | All non-chargeable Google Cloud metrics First 150 MiB per billing account for metrics charged by bytes ingested | July 1, 2018 |
Metrics ingested by using Google Cloud Managed Service for Prometheus, including GKE control plane metrics | $0.060/million samples†: first 0-50 billion samples ingested# $0.048/million samples: next 50-250 billion samples ingested $0.036/million samples: next 250-500 billion samples ingested $0.024/million samples: >500 billion samples ingested | Not applicable | August 8, 2023 |
Monitoring data ingested by using GKE workload metrics | GKE workload metrics is deprecated and removed in GKE 1.24. During the deprecation period, ingestion of GKE workload metrics is not charged. | Not applicable | Not applicable |
Monitoring API calls | $0.01/1,000 Read API calls (Write API calls are free) | First 1 million Read API calls included per billing account | July 1, 2018 through October 1, 2025 |
Monitoring API calls | No charge for write API calls Read API calls: $0.50/million time series returned♥ | Write API calls: Not applicable Read API calls: First 1 million time series returned per billing account | October 2, 2025 |
Execution of Monitoring uptime checks | $0.30/1,000 executions‡ | 1 million executions per Google Cloud project | October 1, 2022 |
Execution of synthetic monitors | $1.20/1,000 executions* | 100 executions per billing account | November 1, 2023 |
1 For pricing purposes, all units such as MB and GB represent binary measures. For example, 1 MB is 220 bytes. 1 GB is 230 bytes. These binary units are also known as mebibyte(MiB) and gibibyte(GiB).
† Google Cloud Managed Service for Prometheus uses Cloud Monitoring storage for externally created metric data and uses the Monitoring API to retrieve that data. Managed Service for Prometheus meters based on samples ingested instead of bytes to align with Prometheus' conventions. For more information about sample-based metering, see Pricing for controllability and predictability. For computational examples, see Pricing examples based on samples ingested.
# Samples are counted per billing account.
♥ There is no charge for read API calls issued through the Google Cloud console, excluding those issued through the Cloud Shell. Read API calls that aren't issued through the Google Cloud console and that can return time-series data are charged by the number of time series that are returned or for one time series, which ever is larger. There is no charge for other read API calls. For more information, see Cloud Monitoring API pricing.
‡ Executions are charged to the billing account in which they are defined. For more information, see Pricing for uptime-check execution.
* Executions are charged to the billing account in which they are defined. For each execution, you might incur additional charges from other Google Cloud services, including services such as Cloud Functions, Cloud Storage, and Cloud Logging. For information about these additional charges, see the pricing document for the respective Google Cloud service.
Take the next step
Start building on Google Cloud with $300 in free credits and 20+ always free products.
Need help getting started?
Contact salesWork with a trusted partner
Find a partnerContinue browsing
See all products