동일한 Look 또는 대시보드에서 여러 기간으로 필터링된 측정항목을 비교하려면 필터링된 측정을 사용하면 됩니다. 필터링된 측정을 사용하면 전체 쿼리에 필터를 적용하는 대신 측정에 직접 하드코딩된 필터를 직접 적용할 수 있습니다.
비교하려는 기간이 제한된 경우 몇 개의 측정을 하드코딩된 기간 필터(예: '올해' 및 '지난해')로 정의하고 Explore, Look 또는 대시보드에 표시할 수 있었습니다. 또한 이 방식을 한 단계 더 발전시켜 필터링된 측정에서 템플릿 필터를 사용해 동적으로 기간을 비교하거나 Explore, Look 또는 대시보드에서 사용자가 지정된 기간으로 변경하는 측정을 수행할 수 있습니다.
패턴 개요
개략적으로 이 방식에는 3가지 구성요소가 포함됩니다.
Explore, Look 또는 대시보드에 필터 전용 필드로 표시되는 기간마다 템플릿 필터 type: date를 정의합니다.
yesno 유형 측정기준을 만들어 템플릿 필터에 연결해 사용자가 필터 전용 필드의 값을 선택하면 yesno 측정기준에서 충족되는 레코드에 대해 'yes'를 반환하도록 합니다.
value = "yes" 조건으로 yesno 측정기준을 참조하는 필터링된 측정을 만듭니다. 이렇게 하면 측정에서 1단계에서 정의된 필터에 지정된 기간 조건을 충족하는 레코드만 집계합니다.
이 논리를 통해 사용자는 다음 Explore와 같이 다른 기간의 값을 비교하는 분석과 시각화를 만들 수 있습니다.
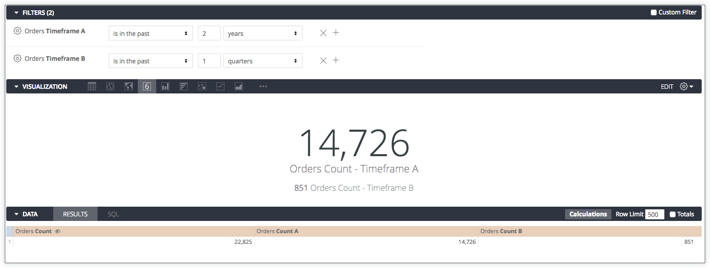
사용자는 기간 A 및 기간 B 필터의 값을 변경하여 주문 수 A 및 주문 수 B 값만 영향을 받을 수 있습니다. 주문 수 A 및 주문 수 B는 기간 필터의 기간 조건을 참조하는 필터로 측정됩니다. 기간 A는 주문 수 A 값에 영향을 미치고 기간 B는 주문 수 B 값에 영향을 미칩니다.
다음 섹션에서는 이 예시의 LookML을 제공합니다.
LookML
다음 LookML에서는 created_raw라는 raw 기간의 측정기준 그룹이 있다고 가정해 보겠습니다.
dimension_group: created {
type: time
timeframes: [
raw,
time,
date,
]
sql: ${TABLE}.created_at ;;
}
개수 측정 비교용 LookML(주문 수 A 및 주문 수 B)은 다음과 같이 created_raw를 기반으로 두 가지 동적 기간(기간 A 및 기간 B)별로 필터링됩니다.
## filter determining time range for all "A" measures
filter: timeframe_a {
type: date_time
}
## flag for "A" measures to only include appropriate time range
dimension: group_a_yesno {
hidden: yes
type: yesno
sql: {% condition timeframe_a %} ${created_raw} {% endcondition %} ;;
}
## filtered measure A
measure: count_a {
type: count
filters: [group_a_yesno: "yes"]
}
## filter determining time range for all "B" measures
filter: timeframe_b {
type: date_time
}
## flag for "B" measures to only include appropriate time range
dimension: group_b_yesno {
hidden: yes
type: yesno
sql: {% condition timeframe_b %} ${created_raw} {% endcondition %} ;;
}
measure: count_b {
type: count
filters: [group_b_yesno: "yes"]
}
이 논리를 사용하여 기간 비교를 필요한 만큼 만들 수 있습니다.
동적 기간으로 전체 쿼리 필터링
필터링된 측정은 필터 조건을 전체 쿼리 결과에 적용하지 않습니다. 지정된 기간 내에서 전체 쿼리 결과를 제한하려면 다음을 수행하면 됩니다.
[[["이해하기 쉬움","easyToUnderstand","thumb-up"],["문제가 해결됨","solvedMyProblem","thumb-up"],["기타","otherUp","thumb-up"]],[["이해하기 어려움","hardToUnderstand","thumb-down"],["잘못된 정보 또는 샘플 코드","incorrectInformationOrSampleCode","thumb-down"],["필요한 정보/샘플이 없음","missingTheInformationSamplesINeed","thumb-down"],["번역 문제","translationIssue","thumb-down"],["기타","otherDown","thumb-down"]],["최종 업데이트: 2025-03-04(UTC)"],[],[],null,["# Timeframe versus timeframe analysis using templated filters\n\n\u003cbr /\u003e\n\n\nTo compare a metric filtered by several timeframes in the same Look or dashboard, you can use [filtered measures](/looker/docs/reference/param-field-filters). Filtered measures let you apply a hardcoded filter directly to a measure, rather than applying a filter to an entire query.\n\n\u003cbr /\u003e\n\n| **Note:** For [dialects that support period-over-period measures](/looker/docs/period-over-period#supported_dialects_for_period_over_period), you can create a LookML measure of `type: period_over_period` to create a period-over-period measure. See the [Period-over-period measures in Looker](/looker/docs/period-over-period) documentation page for more information.\n\n\u003cbr /\u003e\n\n\nIf you had a limited number of timeframes that you were interested in comparing, you could define a few measures with hardcoded timeframe filters (for example, \"this year\" and \"last year\") and display them in an Explore, a Look, or a dashboard. You can also take this approach a step further to make timeframe comparisons dynamic --- or measures that change with timeframes specified by users in [Explores](/looker/docs/creating-and-editing-explores), [Looks](/looker/docs/viewing-looks), or [dashboards](/looker/docs/viewing-dashboards) --- by using [templated filters](/looker/docs/templated-filters) in filtered measures.\n\nPattern overview\n----------------\n\n\nOn a high level, this approach involves three components:\n\n1. Define a templated filter of `type: date` for each timeframe that will appear as a [filter-only field](/looker/docs/reference/param-field-filter) on your Explore, Look, or dashboard.\n2. Create a [`yesno`](/looker/docs/reference/param-dimension-filter-parameter-types#yesno) type dimension to tie to the templated filter so that when a user selects a value for the filter-only field, the `yesno` dimension returns \"yes\" for records that meet the filter's conditions.\n3. Create a filtered measure that references the `yesno` dimension with the condition `value = \"yes\"`. This ensures that the measure only aggregates records that meet the timeframe condition that is specified in the filter that is defined in step 1.\n\n\u003cbr /\u003e\n\n\nThis logic lets users create analyses and visualizations that compare values from different timeframes, like the following Explore:\n\n\nUsers can change the values in the **Timeframe A** and **Timeframe B** filters and only impact the values for **Orders Count A** and **Orders Count B** . **Orders Count A** and **Orders Count B** are measures with filters that reference the timeframe conditions in the timeframe filters. **Timeframe A** impacts the values for **Orders Count A** , and **Timeframe B** impacts the values for **Orders Count B**.\n\n\nThe following section provides the LookML for this example.\n\nThe LookML\n----------\n\n\nThe following LookML assumes that you have a dimension group with a [`raw`](/looker/docs/reference/param-field-dimension-group#timeframe_options) timeframe named `created_raw`: \n\n```\n dimension_group: created {\n type: time\n timeframes: [\n raw,\n time,\n date,\n ]\n sql: ${TABLE}.created_at ;;\n }\n \n```\n\n\u003cbr /\u003e\n\n\nThe LookML for comparing count measures --- **Orders Count A** and **Orders Count B** --- filtered by two dynamic timeframes --- **Timeframe A** and **Timeframe B** --- based on `created_raw` looks like this:\n\n\u003cbr /\u003e\n\n```\n ## filter determining time range for all \"A\" measures\n filter: timeframe_a {\n type: date_time\n }\n ## flag for \"A\" measures to only include appropriate time range\n dimension: group_a_yesno {\n hidden: yes\n type: yesno\n sql: {% condition timeframe_a %} ${created_raw} {% endcondition %} ;;\n }\n ## filtered measure A\n measure: count_a {\n type: count\n filters: [group_a_yesno: \"yes\"]\n }\n ## filter determining time range for all \"B\" measures\n filter: timeframe_b {\n type: date_time\n }\n ## flag for \"B\" measures to only include appropriate time range\n dimension: group_b_yesno {\n hidden: yes\n type: yesno\n sql: {% condition timeframe_b %} ${created_raw} {% endcondition %} ;;\n }\n measure: count_b {\n type: count\n filters: [group_b_yesno: \"yes\"]\n }\n```\n\n\nYou can use this logic to create as many timeframe comparisons as you need.\n\nFiltering an entire query with dynamic timeframes\n-------------------------------------------------\n\n\nFiltered measures do not apply a filter condition to overall query results. If you want to limit the overall query results within the specified timeframes, you can:\n\n1. Create the following `yesno` dimension\n2. Filter the dimension values by \"yes\" in Explores, Looks, or dashboards:\n\n\u003cbr /\u003e\n\n```\n dimension: is_in_time_a_or_b {\n group_label: \"Time Comparison Filters\"\n type: yesno\n sql:\n {% condition timeframe_a %} ${created_raw} {% endcondition %} OR\n {% condition timeframe_b %} ${created_raw} {% endcondition %} ;;\n }\n```\n\n\nThis prevents the database from scanning more data than needed for the query --- and may help with performance and query cost."]]