마크다운 텍스트 타일에 이미지 URL을 하드 코딩하여 Looker 대시보드에 이미지를 추가할 수 있습니다. 하지만 텍스트 타일의 이미지는 정적이며 결과에 따라 업데이트되지 않습니다. 사용자가 선택한 필터 값에 따라 대시보드 이미지를 동적으로 변경하려면 어떻게 해야 할까요?
이 권장사항 페이지에서는 Liquid 및 html 매개변수를 사용하여 동적 대시보드 이미지를 구현하는 방법을 보여줍니다.
해결 방법
다음 솔루션은 가상의 전자상거래 데이터 세트의 상태를 나타내는 users.state라는 필드가 포함된 전자상거래 데이터 세트를 기반으로 합니다.
dimension: state {
  type: string
  sql: ${TABLE}.state ;;
}
사용자가 대시보드 결과를 필터링하기로 선택한 상태를 기준으로 업데이트되는 대시보드에 상태 플래그 이미지를 표시한다고 가정해 보겠습니다.
동적 대시보드 이미지를 만들려면 다음 세 단계를 완료해야 합니다.
- LookML에서 이미지 크기를 만듭니다.
- 동적 이미지 대시보드 타일을 만듭니다.
- 대시보드 필터 및 최종 터치를 추가합니다.
1단계: LookML에서 이미지 크기 만들기
LookML에서 이미지 크기를 만들려면 다음 안내를 따르세요.
- 먼저 프로젝트로 이동하고 이미지를 추가할 측정기준이 포함된 파일을 확인합니다. 그런 다음 해당 필드를 기반으로 새 측정기준, 특히 이미지 표시에 사용할 측정기준을 만듭니다.
-
이미지를 표시할 각 값에
value변수를 사용하여 Liquid{% if %}조건문을 정의하는html매개변수를 추가합니다.예를 들어 다음
state_flag_image측정기준은state값이"California","New York","Colorado"또는"Illinois"일 때 지정된 이미지(html <img>태그 사용)를 표시하는 조건을 설정합니다. 다른 모든 주에서는 '사용 가능한 이미지 없음' 아이콘을 표시할 수 있습니다.dimension: state_flag_image { type: string sql: ${state} ;; html: {% if state._value == "California" %} <img src="https://upload.wikimedia.org/wikipedia/commons/0/01/Flag_of_California.svg" height="170" width="255"> {% elsif state._value == "New York" %} <img src="https://upload.wikimedia.org/wikipedia/commons/thumb/1/1a/Flag_of_New_York.svg/1200px-Flag_of_New_York.svg.png" height="170" width="255"> {% elsif state._value == "Colorado" %} <img src="https://upload.wikimedia.org/wikipedia/commons/thumb/4/46/Flag_of_Colorado.svg/255px-Flag_of_Colorado.svg.png" height="170" width="255"> {% elsif state._value == "Illinois"%} <img src="https://upload.wikimedia.org/wikipedia/commons/thumb/0/01/Flag_of_Illinois.svg/1200px-Flag_of_Illinois.svg.png" height="170" width="255"> {% else %} <img src="https://upload.wikimedia.org/wikipedia/commons/thumb/a/ac/No_image_available.svg/1024px-No_image_available.svg.png" height="170" width="170"> {% endif %} ;; } -
이미지를 표시할 각 값에 대한 값 조건을 만듭니다. 또는 시각화에 이미지를 추가하는 방법 커뮤니티 게시물에 설명된 대로
valueLiquid 변수를 사용해 동적 이미지 필드를 만들 수도 있습니다.
그런 다음 이미지 크기에 대한 대시보드 타일을 만들 수 있습니다.
2단계: 동적 이미지 대시보드 타일 만들기
이제 이미지 크기(state_flag_image)를 만들었으므로 동적 이미지 대시보드 타일이 되는 Explore를 빌드할 수 있습니다.
다음 기준으로 Explore를 빌드합니다.
-
원래 측정기준 (이 경우
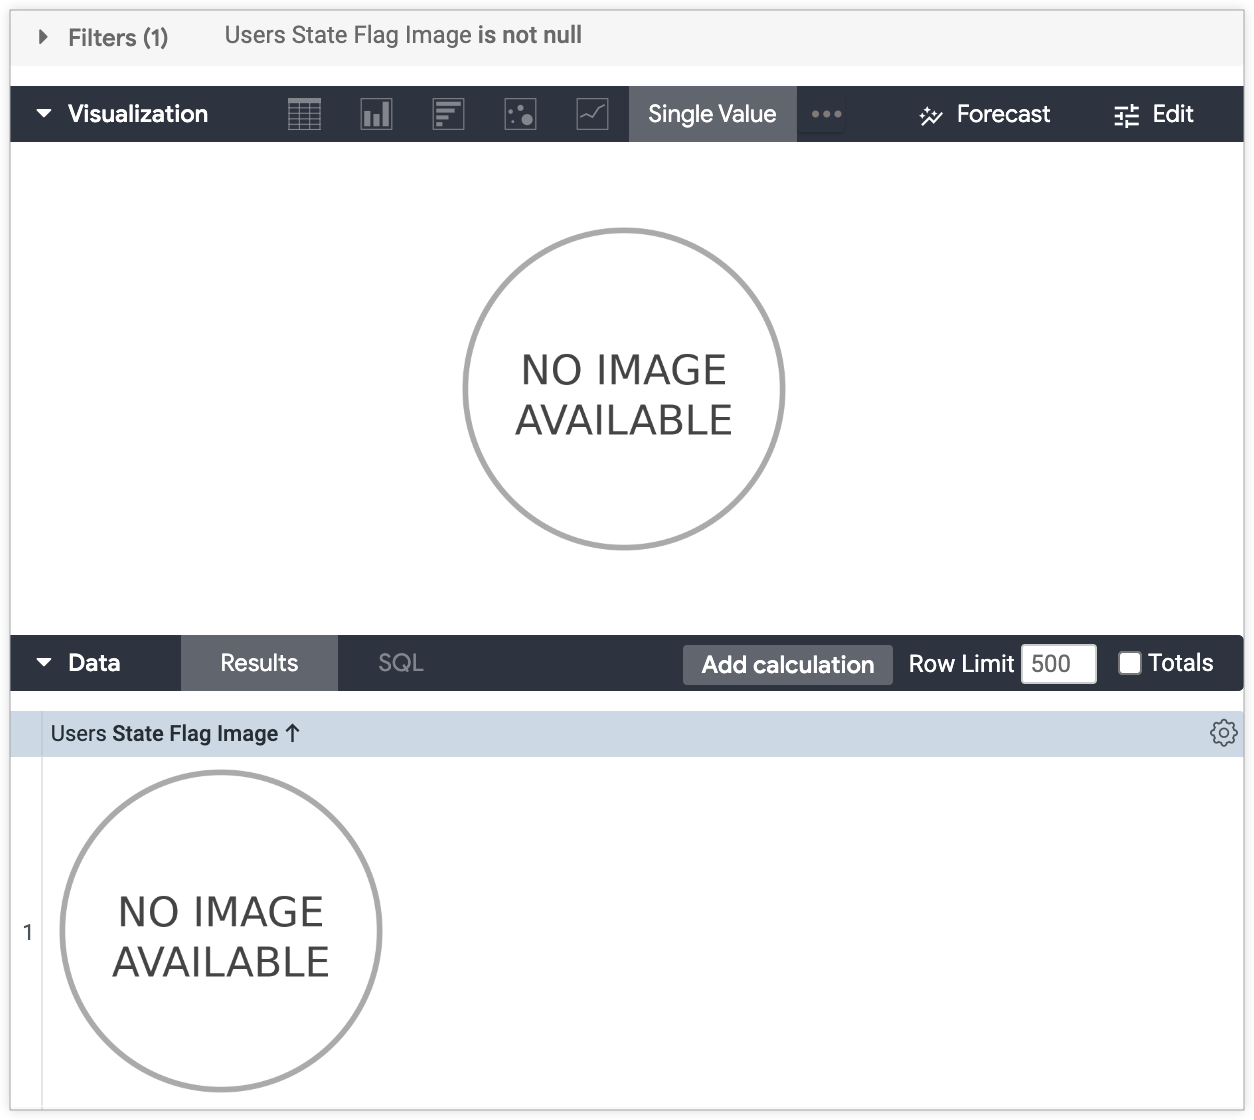
state)에 대한 필터를 추가합니다. 필터를 원하는 값으로 설정합니다. 구체적인 필터 값이 선택되지 않았으므로 '사용 가능한 이미지 없음' 이미지가 처음에 표시됩니다. 이 필터 값은 사용자가 대시보드 필터에 선택한 내용에 따라 업데이트됩니다. -
이미지 크기(이 경우
state_flag_image)와 이미지를 결정하는 쿼리에 필요할 수 있는 다른 측정기준(예: 날짜를 고려할 경우 날짜 포함, 등)을 선택합니다. - 행 한도를 1개 행으로 변경합니다.
-
시각화 유형을 단일 값 시각화로 변경하고 이미지 크기(
state_flag_image)를 제외한 다른 열을 숨깁니다.
Explore에서는 처음에는 시각화 패널에 렌더링된 단일 값 시각화에 '이미지 없음' 이미지를 표시합니다. 표시 이미지는 사용자가 최종 대시보드에서 선택한 필터 값에 따라 변경됩니다.
Explore를 타일로 대시보드에 저장합니다.
3단계: 대시보드 필터 및 최종 터치 추가
이제 대시보드에 대시보드 필터를 추가해야 합니다. 대시보드의 필터는 Explore에 있는 필터를 업데이트하여 사용자 선택에 따라 표시되는 이미지를 변경합니다.
대시보드의 수정 모드에서 필터를 만듭니다.
- 필터 추가 창을 엽니다.
- 필터링 기준으로 사용할 필드를 선택합니다. 필터 필드는 이미지 크기의 기준이 되는 측정기준이어야 합니다. 이 예시에서 필터 필드는 state입니다.
- 업데이트할 타일 탭에서 2단계의 이미지 타일을 선택합니다.
- 필터링할 필드 인라인 드롭다운 메뉴에서 원래 측정기준(이 경우 state)을 선택합니다. 원하는 대로 업데이트할 다른 타일을 선택합니다.
- 원하는 대로 필터를 맞춤설정합니다. 고급 컨트롤 옵션을 선택할 경우 고급 컨트롤 옵션에 자동으로 사용 설정되는 여러 필터 값 허용 옵션이 선택 해제되어 있어야 합니다.
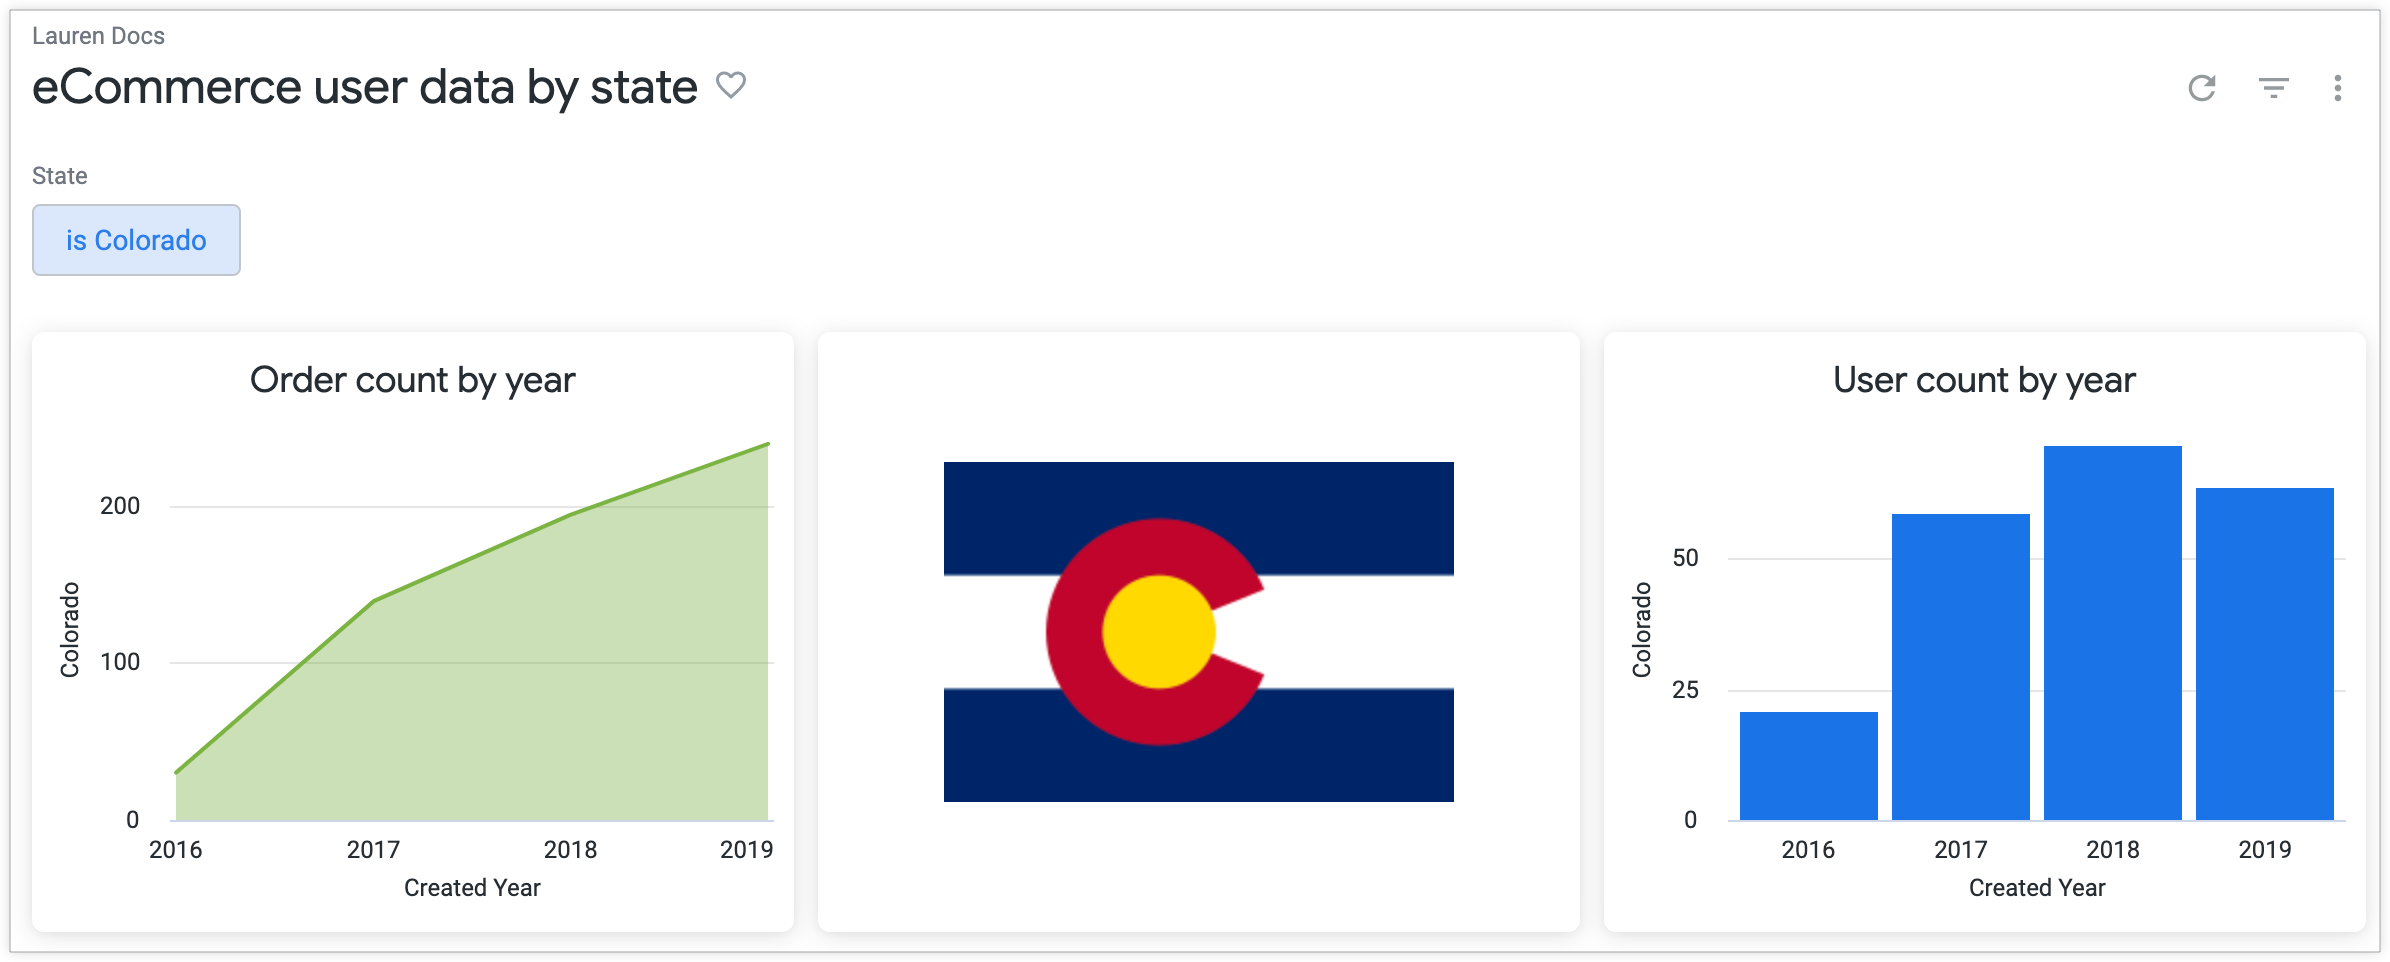
이제 이미지 타일이 사용자 필터 선택에 따라 업데이트됩니다.
사용자가 '캘리포니아'를 기준으로 필터링하면 대시보드에 캘리포니아 주의 주기와 데이터가 표시됩니다.

사용자가 '콜로라도'로 필터링하면 대시보드에 콜로라도주의 주기와 데이터가 표시됩니다.