The Cost table report, available in the Google Cloud console, is a cost management tool that you can use to understand the costs that reconcile to your invoice. The report gives you a detailed tabular view of your costs for a given invoice or statement (by Invoice month). If you're viewing the report using filters in their default state, the Cost table report totals match your invoice or statement totals, and the report generally includes all costs incurred during a given calendar month.
The Cost table report includes project-level cost details from your invoices and statements, including your tax costs broken out by project. The report also includes other details like service IDs, SKU IDs, and project numbers.
The report view is customizable and downloadable to CSV.
Beginning with your January 2021 invoice or statement (available in February 2021), all cost details, including product-level costs and costs by subaccounts (for Resellers), were removed from the invoices and statements that you receive (both PDF and CSV format). The invoices and statements contain company information (such as billing address, Cloud Billing account ID, and payment terms), your cost totals, taxes, and remittance instructions. Instead of the cost details, your invoice provides a link to the Cost table report for the Cloud Billing account.
In the Cost table report, Invoice month refers to the time period that an invoice or statement covers. The detailed usage costs included for an invoice month might differ slightly from the detailed usage costs for a calendar month. For more information, see How costs are calculated for an invoice month.
Permissions required to access the Cost table report
To view the Cost table report for your Cloud Billing account, you need a role that includes the following permission on your Cloud Billing account:
billing.accounts.getSpendingInformationto view costs and usage for a billing account.
To gain this permission, ask your administrator to grant you one of the following Cloud Billing IAM roles on your Cloud Billing account:
- Billing Account Viewer
- Billing Account Costs Manager
- Billing Account Administrator
For more information about billing permissions, see:
- Overview of Cloud Billing access control
- Create custom roles for Cloud Billing
- Understanding predefined IAM roles for Cloud Billing
Access the report
To view the Cost table report for your Cloud Billing account:
In the Google Cloud console, go to your Cloud Billing account.
At the prompt, choose the Cloud Billing account for which you want to view reports. The Billing Overview page opens for the selected billing account.
In the Cost management section of the Billing navigation menu, select Cost table.
By default, when you first access the report, you see the data for the most
recent complete month, grouped by Project > Service > SKU > Consumption model,
without any filtering of the data, and including all the applicable
columns of data.
How to read the cost table
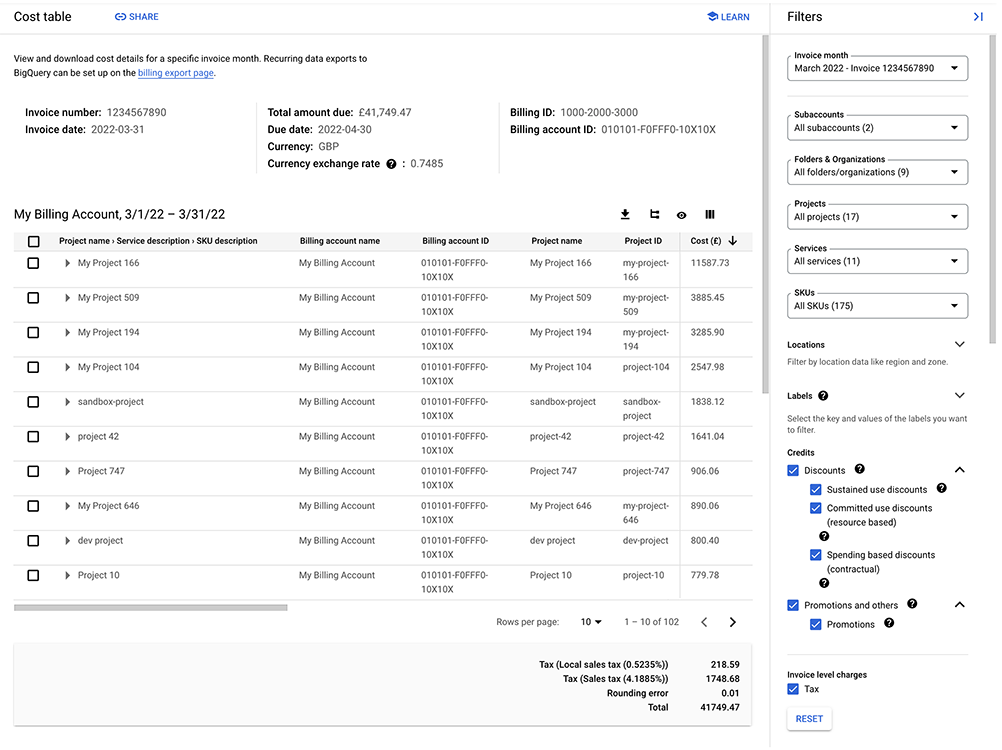
The Cost table shows you a detailed breakdown of all your costs and credits for the selected invoice or statement and provides tools for cost analysis.
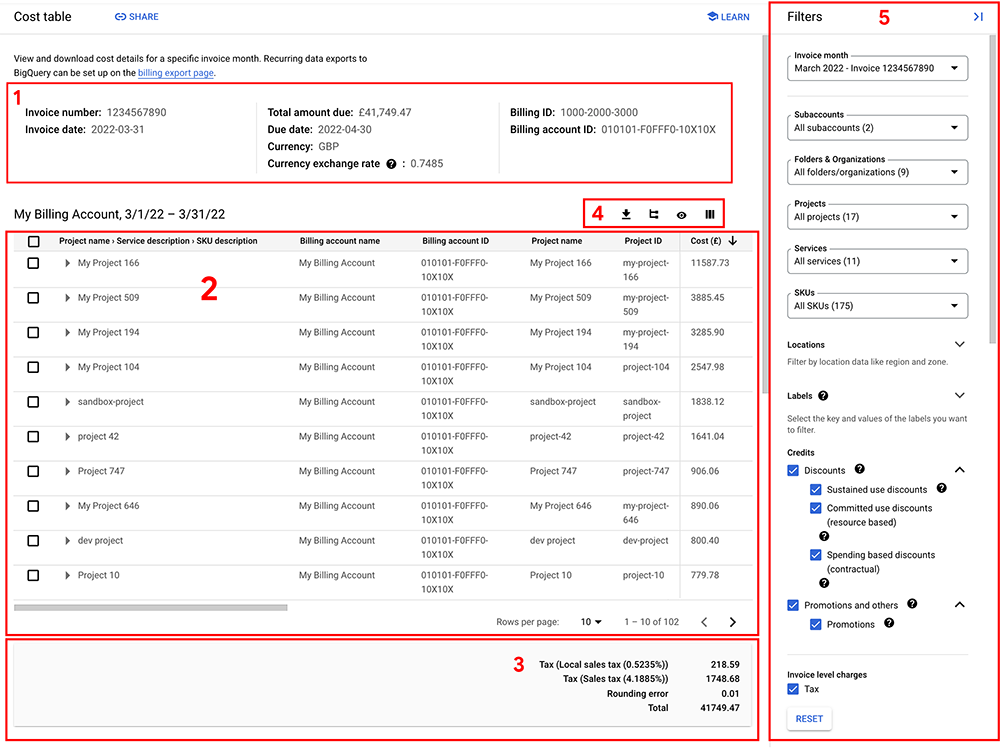
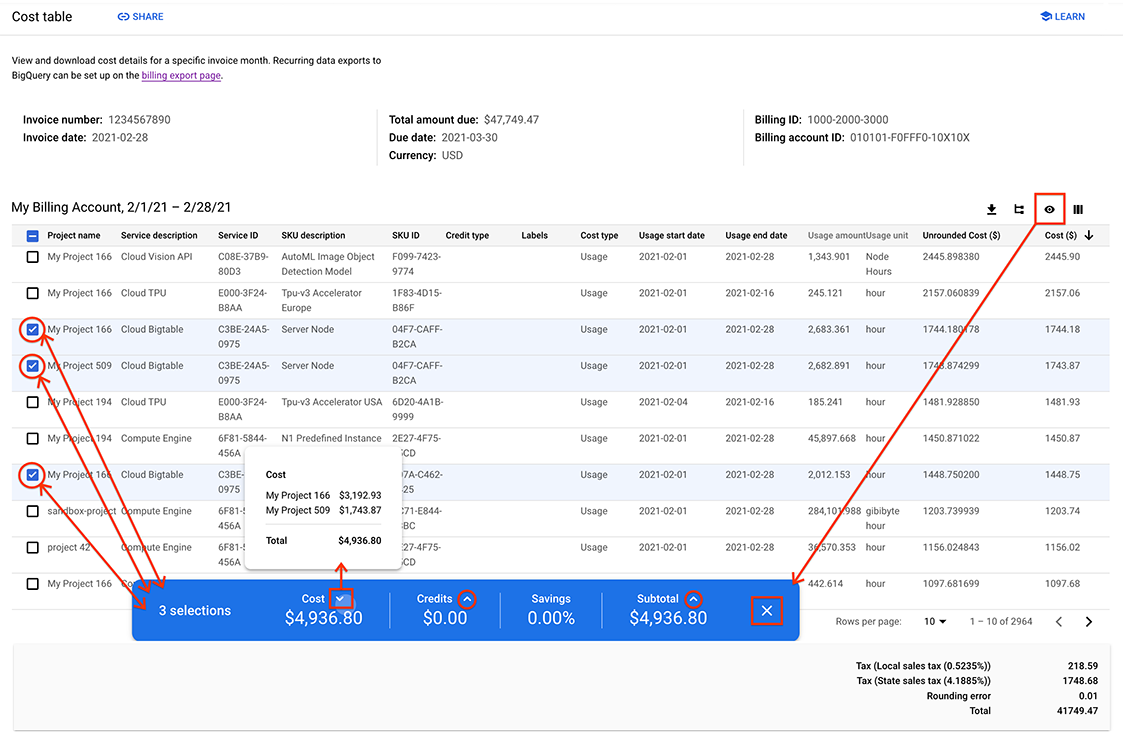
The previous screenshot highlights the different sections of the Cost table page. The following information provides an overview of each section (the numbers below match the number in the screenshot for each section).
Header information for the invoice or statement. Starting with the September 2020 invoice month, the Cost table report includes invoice or statement header information. The header includes your billing account ID, the invoice number and date, the invoice total, the currency of your Cloud Billing account, and the currency exchange rate (available starting April 2021, for accounts billed in a non-USD currency).
Starting with the November 2024 invoice month, the header includes a Publisher type field, to indicate the publisher associated with the transactions and to support split invoices, separating transactions made directly with Google (first party) from transactions made with a partner (third party). The possible Publisher type values are:
- Google: First-party, unregulated transaction by Google Cloud.
- Partner: A third-party, regulated or unregulated transaction by a partner.
If you're a Reseller, the invoice header information displays only on the parent Cloud Billing account, and isn't displayed when viewing the report for one of your Cloud Billing subaccounts.
Table view of your detailed costs. You can customize the table view using the report settings. Two different types of table views are available: nested table (default) and flat table. You can also control which columns are displayed in the table, and you can use filters to refine the report data to analyze your costs.
To gain more flexibility when analyzing your data in the Cost table, you can enable a floating summary bar when you select specific rows to analyze. The summary bar works in both nested and flat table views.
Table footer that displays the totals of the costs in the table view.
When you view the report using filters in their default state, the report data in the table returns all costs for the selected invoice month, and the total in the footer matches the total in the report header (1) and matches the invoice or statement total for the selected document.
If you use the filters to adjust the data in the table (such as filtering on selected projects or services), the footer totals will change to reflect the results of the report filters. You can reset the filters to return the filters to their default state.
The totals in the footer include taxes (for each tax type), invoice corrections and billing modifications, and rounding errors (if applicable to your Cloud Billing account), as well as the total of the costs in the table, based on the selected filters.
Table settings and report tools to adjust the display of the table and to download the report data to CSV.
Report filters to refine the cost data returned in the Cost table.
Understand the Cost table views
The detailed cost information for the selected Invoice month and filters is displayed in the table view of the Cost table report. Two different types of table views are available: nested table and flat table. When analyzing your data in the Cost table, you can enable a floating summary bar when you select specific rows to analyze. The summary bar works in both nested and flat table views.
You can customize the display of the table view using the table settings. You can also control which columns are displayed in the table, and you can use filters to refine the usage and cost data returned to the table. For more information, see configure your report views and settings.
Nested table view
A nested table view is a hierarchical, tree-structured view of your cost data, grouped by various dimensions that you specify. Use nested views to see your invoice costs summarized by the grouping dimensions (such as Project > Service > SKU > Consumption model). You can drill down on the cost details for each grouping dimension to see the Cost breakdown of each grouped row.
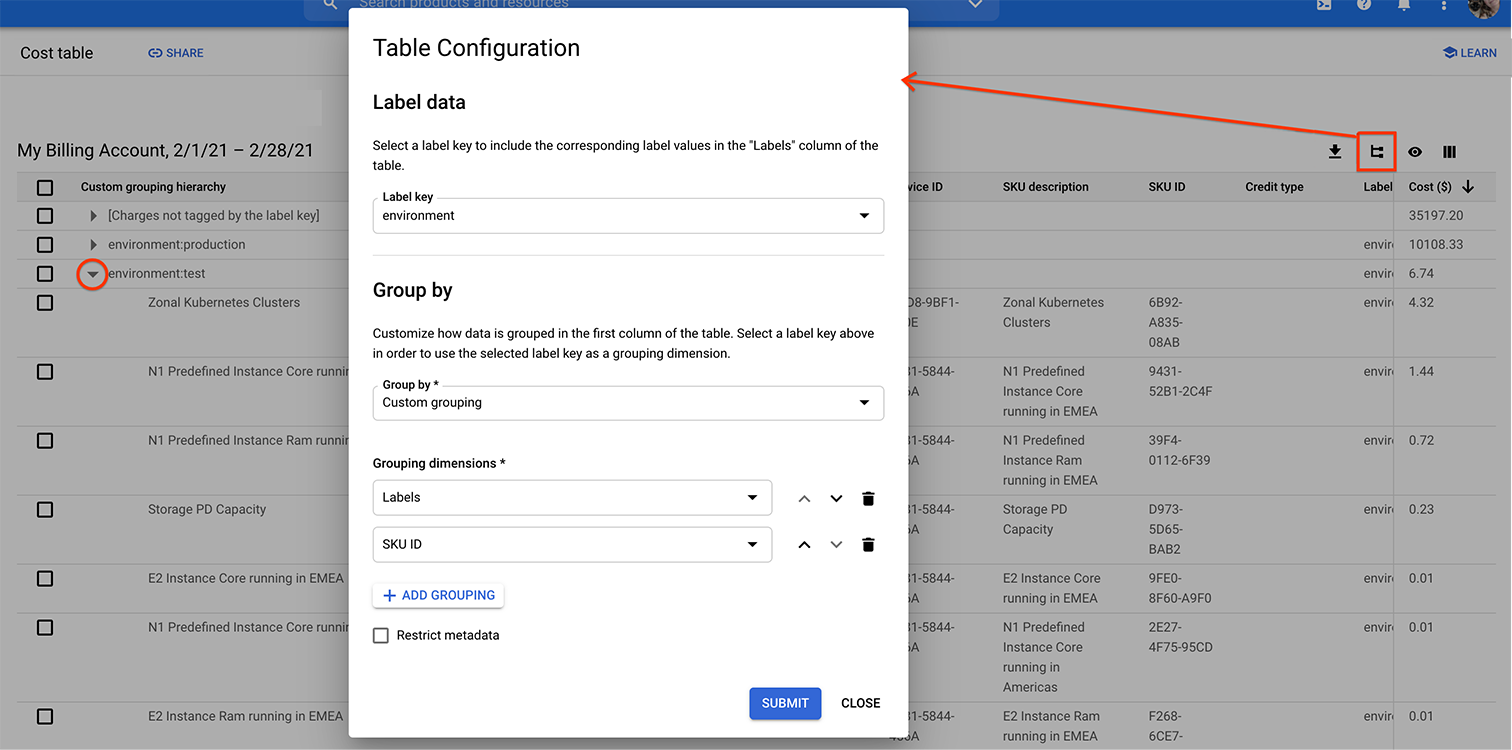
environment:test label row expanded to view the charges by
SKUs tagged with that label key.
In the nested table view:
The first column in the table groups the cost details by the selected option. For example, the Project > Service > SKU > Consumption model Group by option generates a single column called
Project > Service > SKU > Consumption model. If you configure a Custom grouping Group by option, the first column of the table is titledCustom grouping hierarchy.You can expand or collapse the hierarchical cost data in each of the grouped rows to analyze the Cost breakdown of the grouped total.
Each row in the nested table displays hierarchical cost data representing the costs by the grouping level (for example, total costs for a project, or for a service).
Starting with your September 2020 invoice month, your tax costs are separated by each project. To view your tax costs by project in the nested table view, you must use or configure a Group by option with
Projectas the first grouping dimension. For example, group by Project > Service > SKU > Consumption model.Prior to January 2022, if any of your projects have been deleted or moved to a different Cloud Billing account, the project associated with the costs is identified only by the
Project number. Starting January 2022, historical project metadata is available with the addition of project hierarchy data. The values in the project hierarchy column are displayed in the nested table view when you're grouped by Project > Service > SKU > Consumption model. Project hierarchy values are also displayed in the flat table view of the Cost table.
Flat table view
A flat table view is an itemized list of each of the costs and credits incurred for the Invoice month selected. The data displayed in the flat table view depends on the filters that you set. If you're using filters in their default state, the flat table view includes rows for all costs and credits incurred for the selected invoice month, and the Cost table report totals match your invoice or statement totals.
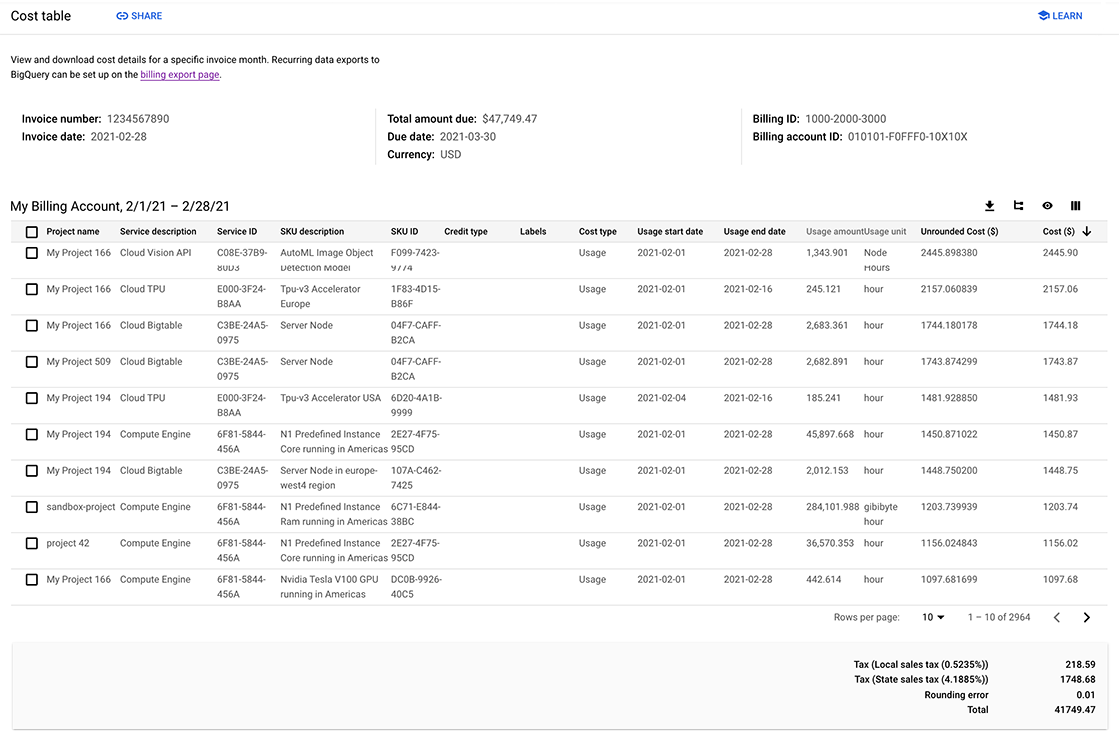
To view your cost data in a non-nested flat table, set the Table configuration Group by setting to No grouping.
In the flat table view:
Each column contains one type of data (for example, Project name, Service description, or SKU description).
Each row with a Usage
Cost typerepresents the total usage costs for a SKU, for a project.If you selected a cost label key, each row represents the total usage costs for a
label_key:label_valuepair for a SKU, for a project (or project hierarchy).If applicable to your Cloud Billing account, the Cost table also includes rows for earned discounts, taxes, rounding errors, and any invoice adjustments.
Starting with your September 2020 invoice month, your tax costs are broken out by each project. In the flat table view, if you've incurred tax costs, each row with a Tax
Cost typerepresents the total tax costs for aSKU description(specific tax type and percentage), for aProject ID.Prior to January 2022, if any of your projects have been deleted or moved to a different Cloud Billing account, the project associated with the costs is identified only by the
Project number. Starting January 2022, historical project metadata is available with the addition of project hierarchy data. The values in the project hierarchy column are displayed only when you're viewing a flat table view or a nested table view grouped by Project > Service > SKU > Consumption model.
Report views with summary bar
The summary bar helps you to perform quick cost analyses of the data returned in the table view. In the Cost table, select the rows you want to analyze; the summary bar displays the sum of the costs and credits, the percentage of savings earned, and the subtotal (net cost) of the selected rows. The summary bar works in both nested and flat table views.
To open the summary bar, take one of the following actions:
- Click the summary bar icon in the toolbar to open or close the summary bar.
- Select individual rows in the table by clicking the row selector check boxes.
When open, the blue, floating summary bar appears on the bottom of the Cost table page.
Information in summary bar
- n selections: Indicates the number of rows selected.
- Cost: The total, gross cost of all selected rows. Click the Cost help icon () to open a cost detail panel. In the panel, costs are grouped by projects, sorted by project name in ascending order.
- Credits: The sum of all credits for the selected rows. Click the Credits help icon () to open a credits detail panel. In the panel, credits are grouped by projects, sorted by project name in ascending order.
Savings: The percentage of savings comparing costs to credits for the selected rows.
Savings % = -1 * Credits / Cost * 100Subtotal: The net cost of the selected rows.
Subtotal = Cost - Credits.Click the Subtotal help icon () to open a subtotal detail panel. In the panel, subtotals are grouped by projects, sorted by project name in ascending order.
To close the summary bar, take one of the following actions:
- Click the summary bar icon in the toolbar to open or close the summary bar.
- In the summary bar, click close ().
Configure your report views and settings
You can select the costs you want to analyze and configure the display of your Cost table report using the following features:
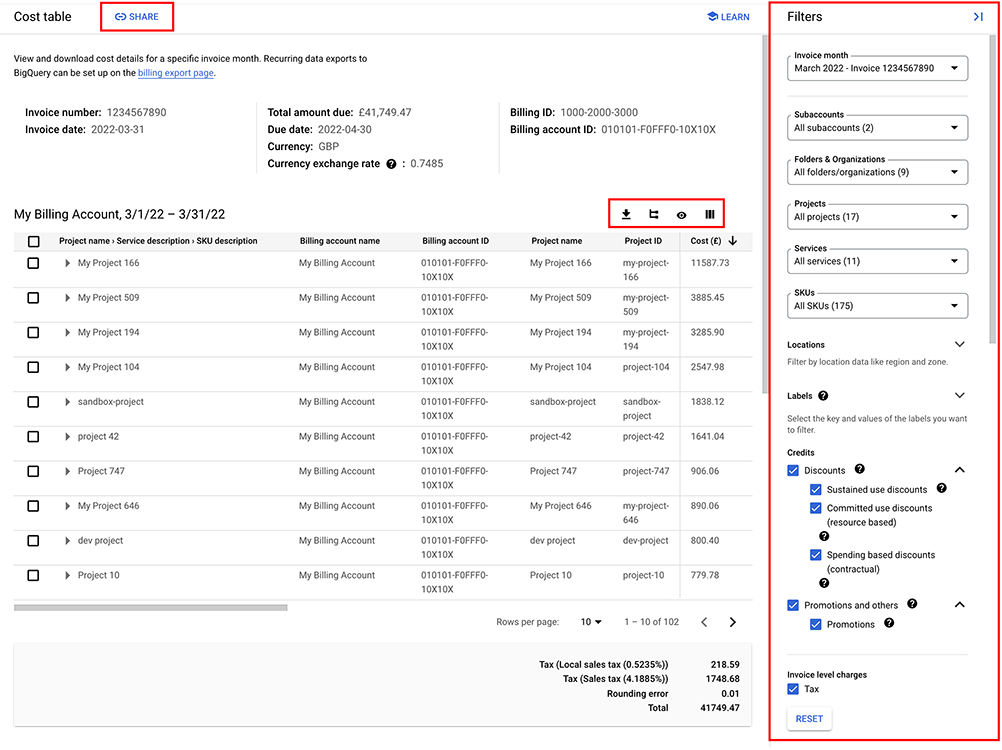
As you configure the report filters, your page URL updates to include your selections. Use Share to copy the URL to share the report.
By default, when you first access the report, you see a nested table displaying the data for the most recent complete month, grouped by Project > Service > SKU > Consumption model, without any filtering of the data, and including all the applicable columns of data.
Invoice month
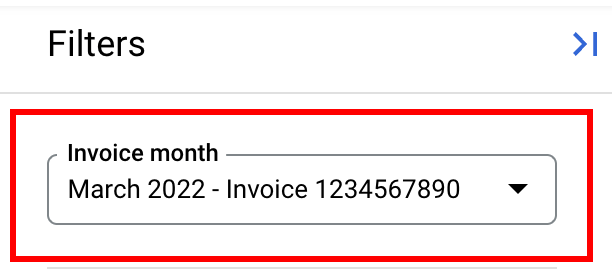
In the Filters panel, use the Invoice month selector to choose the invoice or statement you want to view.
Cost table reports are available for complete months (back to May 2019). Starting with your September 2020 invoice or statement, the invoice or statement number is appended to the month and year. For example, September 2020 - Invoice 1234567890.
Invoice month returns usage and cost details on the invoice or statement issued for the month selected.
For invoiced accounts, it's possible to receive more than one invoice in a calendar month.
- You can select to view only one invoice at a time. You can differentiate between invoices based on the invoice number appended to the invoice month (for example, two different invoices that were issued in April 2021 might look like this: April 2021 - Invoice 1002003011 and April 2021 - Invoice 1002003022).
- To support split invoices, starting with the November 2024 invoice month, the publisher type (either Google or Partner) is displayed below the invoice month and number.
For self-serve, online accounts, only one statement is issued each month.
Filters
The Cost table report can show all costs and credits for the selected invoice or statement, or can be filtered to focus on a specific set of resources. By default, when you first access the report, the filters are configured to include all values, and the report total matches the total of your invoice or statement. As you set filters, the data displayed in the Cost table report adjusts to represent the costs and credits based on the filters selected.
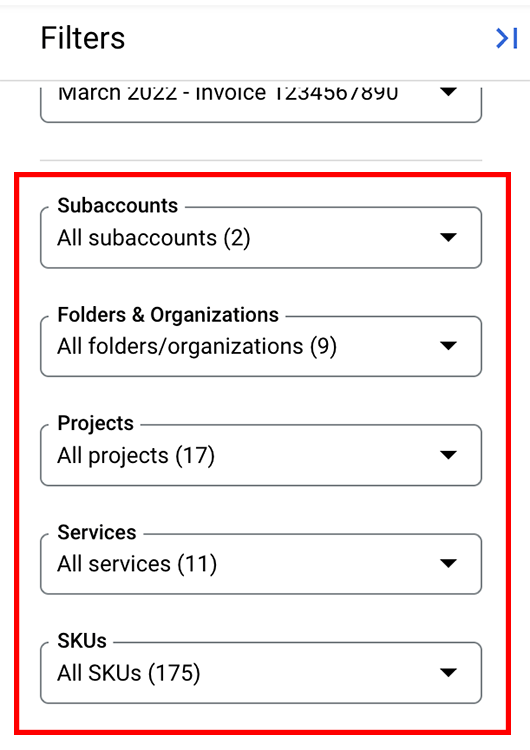
Subaccounts: If you're viewing a primary billing account with subaccounts, you can select all subaccounts (default) or select a subset of subaccounts by clicking them in the list.
Folders & Organizations: Folders and organizations are components of a project hierarchy, the resource hierarchy mapping of a project. If the Invoice month is configured to start on or after January 2022, you can select all folders and organizations (default) that are associated with the projects that are linked to the Cloud Billing account, or select a subset of folders/organizations.
The values in the selector are listed in alphabetical order by resource name. To determine if a value is an organization or a folder, look at the ID number displayed below each name. ID numbers are prefaced with folders/ or organizations/ to indicate the type of resource.
For the Cloud Billing account you're viewing, if none of the linked projects are associated with any folders or organizations, then this filter option isn't displayed.
To view the folders and organizations in the Cost table report, look at the values displayed in the project hierarchy column.
To learn more about organizations, folders, and project hierarchy, see Billing reports: Analyzing your costs by project hierarchy.
Projects: You can select all Google Cloud projects under the Cloud Billing account (default) or select a subset of projects by clicking them in the list.
Services: You can select all services (default) or select a subset of services by clicking them in the list.
SKUs: You can select all SKUs (default) or select a subset of SKUs by clicking them in the list. To learn more about SKUs, see the pricing table report.
Applications: You can select all App Hub applications (default) or select a subset of applications by clicking them in the list.
App Hub applications might incur usage and costs in more than one billing account and associated projects. Cost data filtered by application might be based on partial data, limited to projects and costs for the Cloud Billing account you are actively viewing.
To filter on costs that are not part of an App Hub application, select [Charges not specific to an application].
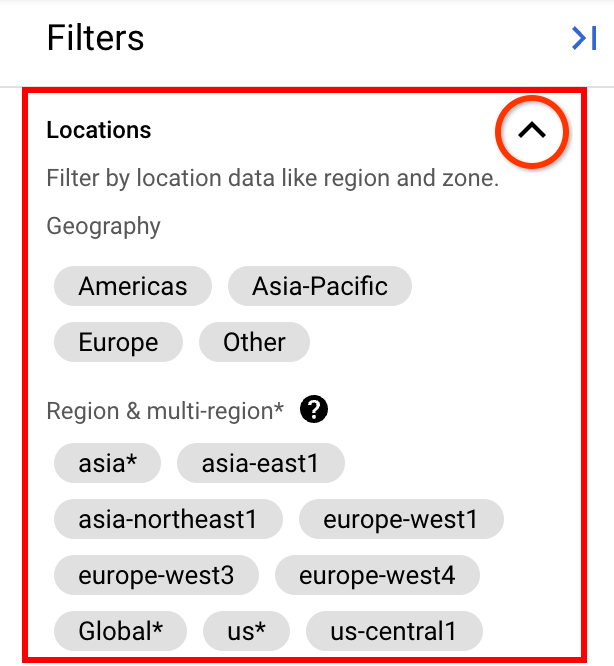
Locations: By default, all locations are enabled. By clicking the location tiles, you can filter on a subset of locations by geography (such as Europe), multi-region (such as Global), or region (such as us-east1). Specifically, the report is filtered by the regions and multi-regions selected.
Use the tiles in geography to quickly select (or deselect) all regions and multi-regions in that geography. Multi-regions tiles are marked with an asterisk (for example,
us*).Learn more about geography and regions.
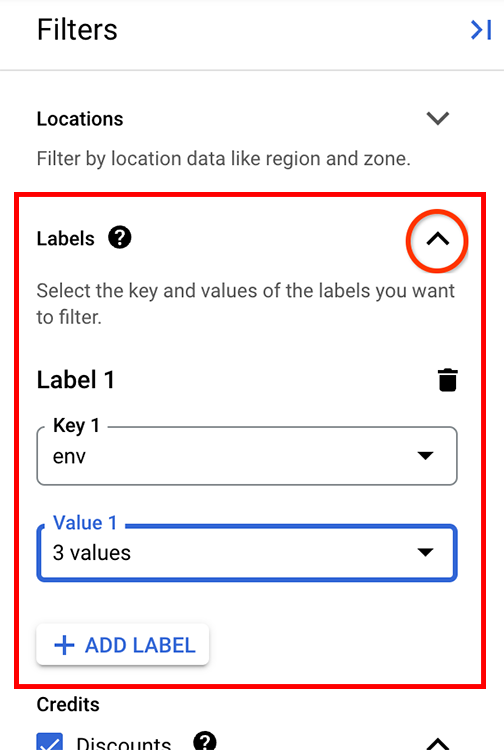
Labels: Labels are key/value pairs you attach to resource usage (for example, Compute Engine or Cloud Storage). To filter usage by label:
- Expand the Labels section.
- Select the label Key.
- Select the Value under that key you want to filter on (the default is all values under the selected key).
To add another label with a different key, click + Add Label, and then select the key and value(s) for the label filter.
To remove a label filter, click (delete) for each label key/value pair you want to remove.
If you want to view costs for Google Kubernetes Engine, you can filter your resources using the following label keys:
goog-fleet-project: Filter cluster resources by fleet host project, if the cluster is registered to a fleet.goog-k8s-cluster-location: Filter GKE resources by location.goog-k8s-cluster-name: Filter GKE resources by cluster.goog-k8s-node-pool-name: Filter cluster resources by node pool.
To filter GKE resources using the following label keys, you must enable cost allocation for your GKE clusters:
k8s-namespace: Filter GKE resources by namespace.k8s-namespace-labels: Filter GKE resources by fleet namespace label.
When filtering by label keys, you can't select labels applied to a project. You can select other user-created labels that you set up and applied to Google Cloud services. For more information about labels, see common uses of labels and creating and managing resource labels.
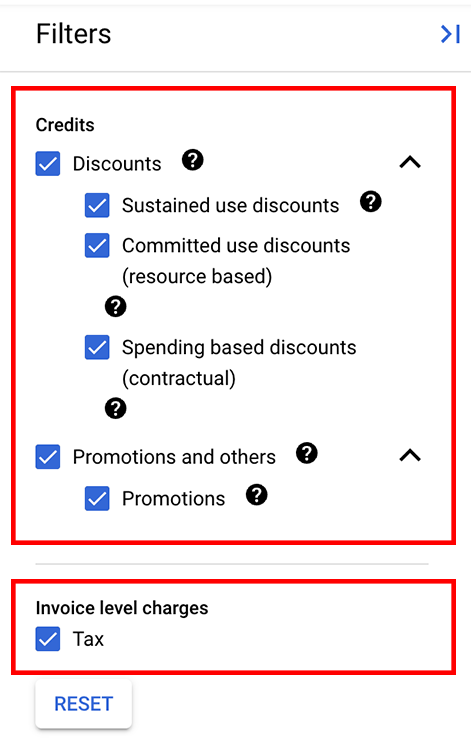
Savings: You can select all applicable savings options (default) to be included in the cost calculations, or you can clear some or all of the savings options to exclude credits and discounts from the cost calculations.
The Savings filter displays only the specific discount and credit types that you incurred in your Google Cloud costs. If a particular type of Savings option doesn't apply to your Cloud Billing account, you won't see that discount or credit option in the list.
In the Cost table, information about your Savings options is shown in the Credit type, Credit name, and Credit ID columns. A SKU's Consumption model is also factored into some types of credits and discounts.
See Cloud Billing Reports to learn more about Savings.
Invoice level charges: You can select all invoice-level charges (default) to be included in the Cost table report, or you can clear some or all of the invoice-level options. Invoice-level charges display in the Cost table and in the footer below the table.
- Reset button: In the Cost table report, when filters are in their default state, the costs displayed in the report reconcile to the costs on your invoice or statement. If you set any filters during your report analysis, you can return the report filters to their default state by clicking the Reset button.
Table settings and report tools

The table settings and report tools are located above the table, and include options to set the table configuration (), control the columns displayed in the table (), toggle the visibility of the summary bar (), and download the report data to CSV ().
Table configuration
-
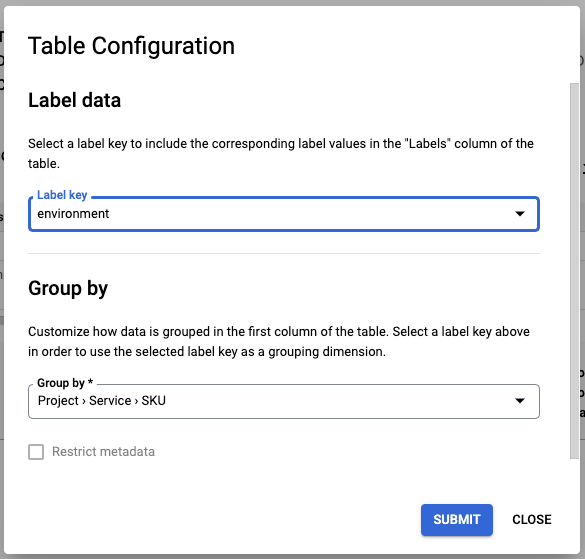
The cost label key setting controls which cost label values are displayed in the Label column, and enables labels as a grouping dimension option when you are configuring a custom Group by option.
To select or change the cost label values that display in the Label column, open the Table configuration dialog, select a Label key, and then click Submit.
- You can select one label key at a time.
- When a label key is selected, a
label_key:label_valuepair is displayed in the Labels column for the resources tagged by the selected cost label key. - You can use the selected label key as a custom Group by grouping dimension.
You can also filter on labels even if you don't set a cost label key. However, the Label column doesn't display any values until you set a cost label key in the table configuration dialog.
Learn more about creating and managing resource labels.
-
The Group by setting controls your table view, letting you switch between a flat table view and various nested table views. This setting also controls which rows download to CSV. Each row in the CSV file shows the costs summarized by lowest-level cost breakdown of the grouping dimension you specify (such as Project > Service > SKU > Consumption model).
Open the Table configuration dialog and choose one of the Group by settings to see a flat or a nested, hierarchical view of the cost data, grouped by the option selected. You can choose a pre-defined Group by option, or define a custom grouping. A nested table summarizes costs into expandable rows, letting you drill down to view the cost details of the rows.
The Group by options available are:
No grouping: Shows a flat Cost table.
Project > Service > SKU > Consumption model: Shows a nested Cost table and groups costs first by project, then service, then SKU, then Consumption model. Click the arrows ( or ) next to a row to expand and collapse the details of the row.
Service > SKU > Consumption model: Shows a nested Cost table and groups costs first by service, then SKU, then Consumption model. Click the arrows ( or ) next to a row to expand and collapse the details of the row.
Custom grouping: Shows a nested Cost table and groups costs by up to three grouping dimensions that you choose, nested hierarchically in the order that you set for the selected dimensions. Click the arrows ( or ) next to a row to expand and collapse the details of the row.
Available custom grouping dimensions include the following:
- Project ID, Service ID, and SKU ID options are always available.
- Consumption model ID is the Consumption model description (such as Default) of the consumption model that applies to the price of usage of a SKU.
- A Labels dimension is available if you first set a Label key. If you group your costs by labels, you will see rows for resource costs grouped by the selected cost label key, and a row for Charges not tagged by the label key.
- A Billing account ID dimension is available for primary billing accounts with subaccounts (reseller accounts). If you're viewing a primary account, the Billing account ID dimension lets you group your costs by the Cloud Billing subaccount.
Column display options
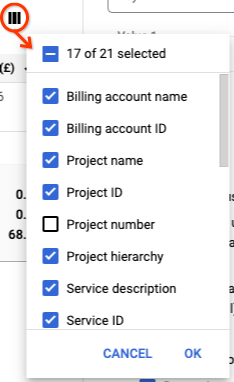
Select the columns to display: You can select or deselect the columns to show in the table using the Column display options selector. This setting also controls which columns download to CSV; that is, only the columns you specify are downloaded.
Depending on your screen width and the number of columns that you're displaying, you might need to scroll horizontally to view all of the columns.
Change the sort order of the data: Click a column header to sort the data in the table by that column. You can toggle the sort between descending () and ascending () order.
Summary bar visibility
Click the summary bar icon in the toolbar to open or close the summary bar.
Using the summary bar, you can quickly analyze a subset of data in the cost table. The summary bar works in both nested table views and flat table views. For more information, see report views with summary bar.
Download report data to CSV
Click the Download to CSV icon in the toolbar to download the report data to CSV. For more details on the CSV download, see download report to CSV.
Share or bookmark the URL of a customized report
You can bookmark or share the URL of a Cost table report you have customized. As you configure your Cost table report by setting the Invoice month, cost grouping options, and report filters, your page URL updates to include your selections.
Note that column display settings () are not included in the URL, due to potential URL length limitations. Your shared URL will open the report with the default columns enabled to display.

- You can share the report by copying the URL. Click Share to copy the URL to your clipboard.
Optionally, in your browser, you can bookmark the URL to save the URL with your report settings.
Download the Cost table report to CSV
You can download the Cost table data to a comma-separated values (CSV) file using the Download CSV selector in the toolbar above the table. The CSV report is a flat file, without any formatting or nested data options. The data that downloads is limited by any filters that you set, includes only the columns that you selected to view, and includes only the rows that match the table configuration () Group by setting. Starting with your September 2020 invoice or statement, the CSV file also includes the invoice or statement header information.
CSV file name
For the Cost table report, the file name follows this pattern:
[Billing Account name]_Cost table, [YYYY-MM-DD] — [YYYY-MM-DD].csv
For example, a CSV file of the cost table data downloaded for a Cloud Billing account named My Billing Account, for an invoice month of March 2023, is named:
My Billing Account_Cost table, 2023-03-01 — 2023-03-31.csv
Notes about the data downloaded to CSV
- The filters you set customize both your online report view (affecting the rows that are displayed in the table), and the data that's downloaded to CSV. If you want to download all of the cost data on your invoice, reset the filters to their default state.
The cost grouping option () you select is used to create a nested view in the online analysis. When you download the data to CSV, a flat file is downloaded, including all of the rows in the Cost table report, with data in individual (not nested) columns. The number of rows of data downloaded is limited by the Group by option you select.
To view and download an itemized list of each of the costs and credits incurred for the selected invoice, choose the No grouping option.
The column selector () lets you customize both your online report view and which fields are downloaded. When you download to CSV, only the columns you specify are downloaded.
Starting with your September 2020 invoice or statement, the Cost table report includes header information pulled from the generated document, including the billing account ID, total amount of the invoice or statement, and currency of the invoice or statement amount. This header information is downloaded to CSV.
Errors when attempting to download CSV
If the CSV file fails to download, you might see one of the following errors:
This file is too large to download: The CSV file size is limited to 150 MB. If you attempt to download a file that exceeds 150 MB, you'll see an error message similar to This file is too large to download. If your file is too large to download to a CSV file, here are a few options you can try:
- To reduce file size, use additional report filters to limit the data that's returned to the Cost table, then download the filtered report.
- Deselect (hide) columns of data that you don't need in your CSV file. Selecting fewer columns to display in the Cost table reduces the amount of data returned and reduces the CSV file size.
- Set custom Group by options to limit the number of rows in the report data.
- Enable billing data export to BigQuery. From your BigQuery tables, you can choose to export your BigQuery data as CSV (or other formats) to a Cloud Storage bucket.
- If you're a Google Cloud reseller or distributor, consider exporting your Channel Services billing data to BigQuery, for detailed billing data that includes all of your customers. Learn more about Channel Services and rebilling your Google Cloud customers.
The download request took too long to respond: The CSV query can take up to 90 seconds to gather data before building the report. A timeout condition can occur when downloading large data sets or if latency issues are encountered. If your CSV download times out, here are a few options you can try:
- Use additional report filters to limit report results and reduce file size and response time.
- Deselect (hide) columns of data that you don't need in your CSV file.
- Don't run concurrent queries. If you started a CSV download, wait until the download process finishes before starting another CSV download. Large files might take about three minutes to process and download.
Columns in the Cost table
The following data is available in the Cost table report (if applicable to your Cloud Billing account).
When you first load the online view of the Cost table report, by default, some columns are not selected to display. You can choose which columns to view in the report by setting the column display options. Also, when you download the report to CSV, only the columns that you've selected to view are downloaded.
| Cost Table Field | Corresponding Invoice Field | Description |
|---|---|---|
| Billing account name | Account Name | The name of the Cloud Billing account that the usage is associated with. If you have access to a primary billing account with subaccounts (a reseller account), this might be the Cloud Billing Subaccount. |
| Billing account ID | Account ID | The Cloud Billing account ID that the usage is associated with. If you have access to a primary billing account with subaccounts (a reseller account), this might be the Cloud Billing Subaccount |
| Project name | Source* * N/A, starting with your November 2019 invoice |
The name of the project that generated the Cloud Billing data. When viewing the report for an invoice month prior to January 2022,
if a project was
deleted or moved to a different Cloud Billing account,
this value is blank, and the project is identified by the
Starting with the January 2022 invoice month, |
| Project ID | N/A |
The ID of the project that generated the Cloud Billing data. When viewing the report for an invoice month prior to January 2022,
if a project was
deleted or moved to a different Cloud Billing account,
this value is blank, and the project is identified by the
Starting with the January 2022 invoice month, |
| Project number | N/A | An internally-generated, anonymized, unique identifier for the project. In your support cases and other customer communication, to protect your privacy, Google will refer to your projects by this project number. When viewing the report for an invoice month prior to January 2022,
if you
delete a project or move the project to a different Cloud Billing account,
the Starting with the January 2022 invoice month, Note: When you first load the Cost table report, by default,
the |
| Project hierarchy | N/A | Project hierarchy data is available starting on January 1, 2022. Projects form the basis for creating, enabling, and using all Google Cloud services. Project hierarchy is the ancestry of a project, the resource hierarchy mapping of the project (Organization > Folder > Project). Projects can stand alone (not be associated with any folders or organizations) or be the child of an Organization or Folder. Project hierarchy tracks the current and historical project ancestry. For example, changing a project's name, or moving a project to a different folder or organization, affects the historical project ancestry. Starting with the January 2022 invoice month, the Cost table report returns a row for each distinct combination of Organization > Folder > Project, and the table includes columns for Project name, Project ID, Project number, and Project hierarchy. The values listed in the Project hierarchy column show Organization name > Folder name.
To analyze your costs by project hierarchy, set the Table configuration Group by setting to No grouping, and sort the Cost table data on different columns:
To learn more about organizations, folders, and project hierarchy, see Billing reports: Analyzing your costs by project hierarchy. |
| Service description | Product | The invoice description of the Google Cloud service or Google Maps Platform API that reported the Cloud Billing data. For example, Compute Engine. |
| Service ID | N/A | The ID of the Google Cloud service or Google Maps Platform API that reported the Cloud Billing data. For example, 6F81-5844-456A. |
| SKU description | Resource Type | The invoice description of the resource SKU used by the service. For example, N1 Predefined Instance Core running in Americas. SKU description also includes different tax types. For example, State sales tax (4.71%) or PST/QST/RST (9.975%). |
| SKU ID | SKU ID | The ID of the resource SKU used by the service. For example, 2E27-4F75-95CD. For the full list of SKUs, see Google Cloud SKUs. |
| Consumption model description | N/A | A consumption model represents the price you pay for a certain amount of
SKU usage within a certain context. A SKU can have several consumption models,
but only one applies to any given amount of usage at a particular time. Each
SKU has at least one consumption model, whose description is
Consumption models often represent various kinds of discounted
prices for SKU usage, such as SKUs covered by committed use discounts (CUDs).
For example, if a one-year Flex CUD covers a particular VM usage, then the
consumption model that applies to that SKU usage has the description
For more information, see Spend-based CUDs program improvements. Note: The first invoice month with
|
| Consumption model ID | N/A | The ID of the consumption model that applies to the price of usage for a SKU. For example, 7754-699E-0EBF. For a list of Consumption model IDs that apply to the new Spend-based CUDs discounts, see Offers and consumption model IDs. Note: The first invoice month with
When you first load the Cost table report, by default,
the |
| Credit type | N/A | This field describes the purpose or origin of the Credit ID.
Credit types include:
If the Note: The first invoice month with
|
| Credit name | N/A | The name of the credit associated with the product SKU. This is a
human-readable description of an alphanumeric Credit ID.
Examples include Free trial credit or
Spend-based CUD.
Note: The first invoice month with
When you first load the Cost table report, by default,
the |
| Credit ID | N/A | If present, indicates that a credit is associated with the product SKU.
Credit ID values are
either an alphanumeric unique identifier (for example,
12-b34-c56-d78), or a description of the credit type (such as
Committed Usage Discount: CPU).
If the credit ID field is empty, then the product SKU isn't associated with a credit. Note: The first invoice month with
When you first load the Cost table report, by default,
the |
| Label | N/A | The label_key:label_value pair. For example,
environment:production. The label_key (for example,
environment) is selected using the Label key selector accessible
in the
Table configuration dialog. The
label_value (for example, production) is one of the
values corresponding to the selected label key.
Learn more about creating and managing resource labels. |
| Cost type | Description | A description of the type of cost for the line item.
|
| Usage start date | Start Date | The date of the first occurrence of usage for this invoice month (see previous note on the possibility of late-arriving usage). |
| Usage end date | End Date | The date of the last occurrence of usage for this invoice month (see previous note on the possibility of late-arriving usage). |
| Usage amount | Quantity | The quantity of usage units used. |
| Usage unit | Unit | The billing unit of the usage (such as hour or gibibyte month). |
| Seller name | N/A | The legal name of the seller. When you first load the Cost table report, by default,
the |
| Transaction type | N/A | The transaction type of the seller. The transaction type might be one of the following:
When you first load the Cost table report, by default,
the |
| Cost in micros | N/A | The calculated cost of the usage in micro units (µ). Micro is a
unit prefix in the metric system denoting a factor of 10−6
(one millionth). When we calculate your usage costs, we convert all costs to
micro units to provide the level of accuracy needed to calculate any
rounding errors. Examples:
When you first load the Cost table report, by default,
the |
| List cost | N/A | The When you first load the Cost table report, by default,
the |
| Unrounded cost | N/A | The calculated cost of the usage, in the
currency the Cloud Billing account is configured to use, to
a precision of up to six decimal places. Unrounded cost is
calculated using the
SKU prices associated with your Cloud Billing account and can be
helpful when analyzing your cost details and understanding the source of
any discrepancies due to rounding.
If you're using the CSV version of this report for analysis, we recommend using the Unrounded
cost column for your calculations.
|
| Cost | Amount | The calculated cost of the usage, in the
currency the Cloud Billing account is configured to use,
rounded to two decimal places.
Cost is calculated using the
SKU prices associated with your Cloud Billing account and
represents the amount charged for usage.
|
Notes about the Cost table report
Matching your invoice
When viewing the report using the default filter settings, the Cost table report matches your existing invoice as closely as possible. On the Cost table report, the display of credits and usage-based discounts (for example, promotional credits or sustained use discounts) are listed as separate line items. Online Cloud Billing reports and Cloud Billing Export to BigQuery don't separate credits and discounts into separate line items.
The Total amount listed in your invoice is the sum of all Unrounded cost
line items, rounded to two decimal places. If you're using the
CSV version of this report
to reconcile to your invoice total, we recommend doing the following:
- Before you download to CSV, reset your filters to their default state.
- Use the
Unrounded costamounts for your calculations.
How costs are calculated for an invoice month
Invoice month refers to the time period that an invoice or statement covers.
- The type of document you receive depends on the
type of Cloud Billing account
you are viewing.
- Invoiced (offline) accounts receive invoices.
- Self-serve (online) accounts receive statements.
- Google Cloud products report usage and cost data to Cloud Billing processes at varying intervals. As a result, you might see a delay between your use of Google Cloud services, and the usage and costs being available to view in Cloud Billing. Typically, your costs are available within a day, but can sometimes take more than 24 hours.
- Late-reported usage costs at the end of an invoice month might not be included on that invoice month's statement or invoice and are reported on the next month's invoice or statement.
- The Cost table report is meant to match the charges on your invoice or statement. The possible result of late-reported usage is that your Cost table report might include costs from more than one calendar month. For example, your October invoice or statement might include costs incurred at the end of September combined with the October costs.
- To view your usage costs by actual usage date (calendar date or date range), see the online reports or analyze your exported billing data.
- Invoice-level charges, including taxes, adjustments, and rounding errors, are included in the Cost table footer. For guidance on understanding and analyzing any adjustments, see Understand memos and adjustments.
If you have a custom pricing contract, you might receive promotional credits to use on Google Cloud as part of the contract. For example, you might receive $1,000 to use on Compute Engine resources. Promotional credits are typically considered a form of payment. When available, promotional credits are automatically applied to reduce your total bill.
The terms of your contract specify whether the promotional credits apply to your costs calculated at the list price of a SKU, or the net price (after discounts). View the
List costcolumn to see your usage costs calculated using list prices.If your promotional credits apply to costs that are calculated at the list price, in the Cost table report, there's a service called
Invoice, with a SKU calledContract billing adjustment. This SKU adjusts your credits so that they apply to the costs at list price. To see the usage that the adjustment is for, use the Cloud Billing data export to BigQuery.
SKU Prices
Invoice usage details don't include a column for the SKU price. If your
Cloud Billing account is associated with a custom pricing contract,
the Unrounded cost and Cost amounts are calculated using the contract
prices. The List cost amounts are calculated using the
publicly available list prices. You can compare List cost to Cost to
determine how much you're saving with your custom contract prices.
To view your prices per SKU, see the Pricing table report or export your Cloud Billing prices to BigQuery. If you have questions regarding pricing per SKU, contact your Account Representative for more details.
Historical project data
Prior to January 1, 2022:
When viewing reports for invoice months prior to January 2022, historical project metadata is not supported in the Cost table report. If you delete a project or move the project to a different Cloud Billing account, the following values are no longer displayed in the Cost table for the project: Project Name, Project ID, Billing account ID, and Billing account name. The Project number value persists after a project is deleted. If you enabled the export of Cloud Billing data to BigQuery, you can find your historical project information in your BigQuery tables.
Starting on January 1, 2022:
When viewing reports for an invoice month on or after January 2022, with the addition of project hierarchy data, historical project metadata is supported in the Cost table. Starting January 1, 2022, when you delete a project or move a project to a different Cloud Billing account, if that project incurred usage during the time period selected, the following values are listed in the Cost table for the project: Billing account name, Billing account ID, Project Name, Project ID, Project number, and Project hierarchy. If you enabled the export of Cloud Billing data to BigQuery, the Cost table's project metadata information should match the historical project information in your BigQuery tables.
Taxes by project and by invoice
Starting September 1, 2020, your cost details in the Cost table
show your tax costs for each of your projects, instead of as an invoice-level
cost. Invoice-level tax totals continue to be displayed in the footer of the
Cost table report. You can identify and filter on your tax details using the
Cost type column and the SKU description column.
For example, for costs recorded before September 1, 2020, your cost detail data looked similar to the following example, which shows a total tax cost of $10.
Billing account ID |
Project ID |
SKU description |
Cost type |
Cost |
|---|---|---|---|---|
| 123456-ABCDEF-123456 | example-project | N1 Predefined Instance Core | Usage | $60 |
| 123456-ABCDEF-123456 | test-project | N1 Predefined Instance Core | Usage | $40 |
| 123456-ABCDEF-123456 | 0 | State sales tax (10.0%) | Tax | $10 |
For costs recorded after September 1, 2020, the $10 tax total is broken
out to attribute $6 for example-project, and $4 for test-project:
Billing account ID |
Project ID |
SKU description |
Cost type |
Cost |
|---|---|---|---|---|
| 123456-ABCDEF-123456 | example-project | N1 Predefined Instance Core | Usage | $60 |
| 123456-ABCDEF-123456 | example-project | State sales tax (10.0%) | Tax | $6 |
| 123456-ABCDEF-123456 | test-project | N1 Predefined Instance Core | Usage | $40 |
| 123456-ABCDEF-123456 | test-project | State sales tax (10.0%) | Tax | $4 |
Viewing project-level taxes in the nested table view
To view your tax costs by project in the nested table view, you must use or configure a Group by option with Project as the first grouping dimension. For example, group by Project -> Service -> SKU.
Viewing project-level taxes in the flat table view
In the
flat table view, if you have incurred tax costs,
project-level taxes are displayed in rows near the end of the table. Each
row with a Tax Cost type represents the total tax costs for a
SKU description (specific tax type and percentage), attributed to a project.
About split invoices
You might receive multiple invoices for a set of transactions, also known as split invoices, if your product purchases meet all of the following criteria:
- You use the Cloud Marketplace to purchase first-party Google products and third-party products from a Google partner reseller.
- Your transactions occur through the agency transaction model.
Split invoices separate the Google services you buy through a Google partner reseller (third-party transactions) from services you buy directly from Google (first-party transactions).
Starting with the November 2024 invoice month, invoices include a Publisher type to indicate the publisher associated with the transactions. The Publisher type is displayed in the Cost table header, and in the Invoice month filter. The possible Publisher type values are:
- Google: First-party, unregulated transaction by Google Cloud.
- Partner: A third-party, regulated or unregulated transaction by a partner.
The Cost table also provides additional columns you can view to see purchase information about your transactions:
Seller name: The legal name of the seller.Transaction type: The transaction type of the seller, indicating services sold by Google, or third-party services either resold by Google or sold by a partner.
These columns are not visible by default. To view the Seller name or
Transaction type columns in your Cost table, select them in the
column display options.
For more information about split invoices, see Split invoicing for agency model transactions.
About totals in the invoice header and the Cost table footer
When your Cost table report is configured to view all costs and credits for an invoice month, typically, the total in the invoice header and the Cost table footer are the same. Rarely, you might notice the header total doesn't match the footer total.
Starting with the September 2020 invoice or statement, the Cost table report includes header information for the document providing details such as the invoice number, the billing account ID, and the invoice or statement totals.
- The invoice total amount due or statement total new activity listed in the header is determined based on the timing of when the invoice or statement document was generated. The total in the report header isn't affected by any filters you might set in the Cost table report.
- The Total listed in the Cost table footer is generated by summing all the
Unrounded costline items in the Cost table report, then rounding to two places. If you set filters to refine the costs returned in the Cost table, the footer total is calculated on the filtered costs.
In some cases, when viewing an unfiltered report, the two totals might not match. This might occur if your Cloud Billing account is issued more than one invoice or statement in a month, or if a credit or debit memo is issued for your billing account. For example:
- If you close your Cloud Billing account, you might be issued more than one invoice or statement in the same month. There is a delay in usage reporting, so you might get an additional invoice to cover the cost of usage that was reported after you closed your Cloud Billing account.
- If you're issued a credit memo, those credits or charges might be applied to your invoice, but not be reflected in the cost line items on the Cost table report. For guidance on understanding and analyzing any adjustments, see Understand memos and adjustments.
If you notice the totals in your Cost table report's header and footer don't match, and you need help reconciling your invoice or statement, contact Cloud Billing Support for assistance.
Related topics
- Get an invoice, statement, or receipt
- Understand your monthly invoice
- View your Cloud Billing reports and cost trends
- Export Cloud Billing data to BigQuery
- View your cost and payment history