형식이 지정된 측정값(type: percent_of_total 또는 value_format_name 또는 value_format 매개변수가 있는 측정값)을 사용하는 경우 렌더링된 값 {{ field_name._rendered_value }}(여기서 field_name은 측정값 또는 측정기준의 실제 이름)에 Liquid 구문을 사용해야 합니다.
예
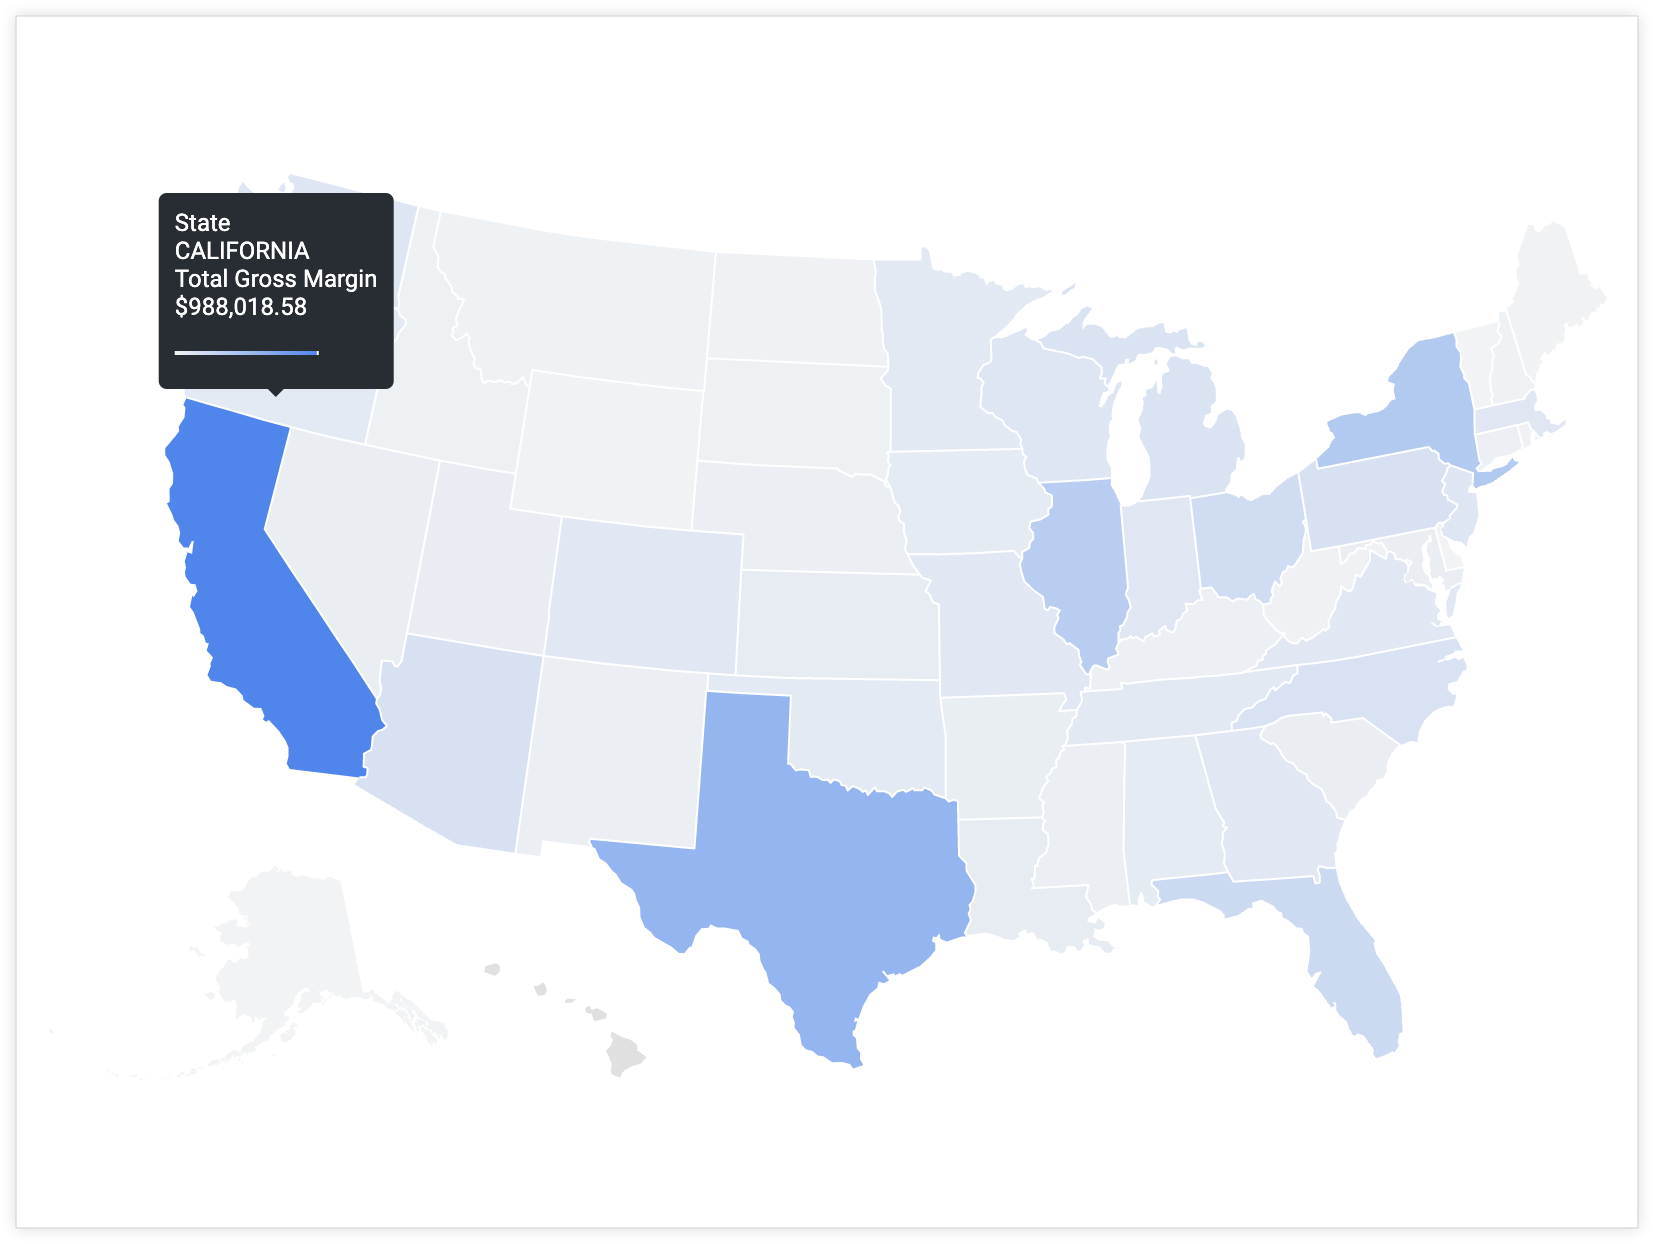
기본적으로 시각화 데이터 포인트의 도움말에는 총이익 및 주 값이 포함됩니다. 하지만 지도에 표시되지 않거나 Explore 쿼리에 포함되지 않은 추가 정보를 사용자에게 제공하려면 어떻게 해야 하나요? 주가 아닌 총이익 비율이라는 필드의 값을 포함하려면 어떻게 해야 하나요? 총이익 비율을 포함하면 사용자가 개별 데이터 포인트의 총이익 값을 데이터 세트의 총이익과 비교하는 방법을 이해하는 데 도움이 됩니다.
도움말을 맞춤설정하려면 다음 단계를 따르세요.
measure: total_gross_margin {
  type: sum
  value_format_name: decimal_2
  sql: ${gross_margin} ;;
  html: {{ rendered_value }} | {{percent_of_gross_margin._rendered_value }} of total ;;
}
도움말에 원래 필드 외에 추가로 포함할 필드 및 값을 결정합니다. 예를 들면 총이익 비율이 있습니다.
Explore 쿼리에서 참조되고 도움말에 표시되는 원래 측정값에 html 매개변수를 추가합니다. 이 경우 현재 Explore 쿼리에 있고 도움말에 표시되는 측정값은 총이익입니다.
html 매개변수에서 기존 측정값에 추가 필드를 추가하는 Liquid 변수로 표현식을 만듭니다.
이 예에서는 Liquid 변수 _rendered_value를 사용하여 Looker 형식의 값을 표시합니다. 예를 들어 total_gross_margin에서는 소수점 이하 두 자리에 Looker 형식을 사용하고 percent_of_total_gross_margin는 소수점 이하 두 자리의 백분율을 표시하기 위해 Looker 형식을 사용합니다.
파이프 기호(|)를 사용하여 여러 필드의 값을 구분할 수 있습니다.
도움말에 렌더링된 다른 값의 의미를 명확하게 설명하는 다른 단어를 추가할 수도 있습니다. 이 경우 백분율 값의 의미를 명확히 하기 위해 of total가 추가됩니다.
코드가 예상대로 작동하는지 확인한 후 코드를 저장하고 검증한 다음 프로덕션으로 푸시합니다.
이제 사용자가 도움말이 포함된 데이터 포인트 위로 마우스를 가져가면 도움말에 데이터 포인트의 total_gross_margin 값과 해당 percent_of_total_gross_margin 값의 두 가지 값이 표시됩니다.
[[["이해하기 쉬움","easyToUnderstand","thumb-up"],["문제가 해결됨","solvedMyProblem","thumb-up"],["기타","otherUp","thumb-up"]],[["이해하기 어려움","hardToUnderstand","thumb-down"],["잘못된 정보 또는 샘플 코드","incorrectInformationOrSampleCode","thumb-down"],["필요한 정보/샘플이 없음","missingTheInformationSamplesINeed","thumb-down"],["번역 문제","translationIssue","thumb-down"],["기타","otherDown","thumb-down"]],["최종 업데이트: 2025-07-31(UTC)"],[],[],null,["# Getting the most out of Looker visualizations cookbook: Tooltip customization\n\n| **Note:** This page is part of the [Looker cookbook: Getting the most out of Looker visualizations](/looker/docs/best-practices/cookbook-visualizations-in-looker).\n| **Tip:** Starting in Looker 24.0, you can use the [Chart Config Editor](/looker/docs/chart-config-editor#customize_tooltip_color) to further customize tooltip style and color.\n\nThe [visualization tooltip](/looker/docs/creating-visualizations#the_visualization_tooltip) displays the value of the selected dimensions and measures by default and can help users understand the significance of a single point of data.\n\nFor example, a tooltip for a map visualization that is based on **Total Gross Margin** grouped by **State** will display values for both fields when a user hovers over the state of California.\n\nHowever, what if you want to include fields *other* than the default in the tooltip so that users can get more information or context about a datapoint without needing to look elsewhere?\n\nYou can customize the tooltip to display values from multiple specified fields --- including fields that are not in the Explore query.\n| **Caution:** HTML formatting only renders in [table](/looker/docs/table-options), [table (legacy)](/looker/docs/legacy-table-options), and [single value](/looker/docs/single-value-options) chart visualizations and in visualization tooltips when multiple fields are combined. Any interactive content that is placed in a [map chart's](/looker/docs/map-options#viewing_map_charts_in_the_new_dashboard_experience) tooltip with the `html` parameter will not be accessible on dashboards that use the [new dashboard experience](/looker/docs/viewing-dashboards), although the content will be accessible on Looks and Explores.\n\nIngredients\n-----------\n\n- [Liquid variables](/looker/docs/liquid-variable-reference) --- Liquid variables render the values of other fields in conjunction with the existing Explore query.\n- [`html` parameter](/looker/docs/reference/param-field-html) --- The fields that are defined in the `html` parameter of a measure will render in the tooltip when a user hovers over a visualization.\n- Visualization --- The tooltip will appear when a user hovers their cursor over a datapoint in certain visualization types.\n - [Cartesian charts](/looker/docs/visualization-guide#cartesian_charts)\n - [Pie or donut charts](/looker/docs/visualization-guide#pie_and_donut_charts)\n - [Progression charts](/looker/docs/visualization-guide#progression_charts)\n - [Map charts](/looker/docs/visualization-guide#maps)\n\nPrerequisites\n-------------\n\nCustomizing the tooltip requires the following:\n\n- Permissions to [create Explores](/looker/docs/admin-panel-users-roles#explore) and permissions to [develop LookML](/looker/docs/admin-panel-users-roles#develop).\n- Knowledge of SQL and LookML development.\n- A basic knowledge of using Liquid in Looker and HTML coding. Visit the [Using Liquid variables in the `html` parameter](/looker/docs/reference/param-field-html#using_liquid_variables_in_the_html_parameter) section of the [`html`](/looker/docs/reference/param-field-html) documentation page for necessary background information.\n- Permissions to [save content](/looker/docs/admin-panel-users-roles#save_content) (if you want to save the visualization as a Look or a dashboard)\n\nConsiderations for tooltip customization\n----------------------------------------\n\nIt is important to consider the following when you're customizing a tooltip:\n\n- The values in the `html` parameter become the y-axis of a visualization.\n- The value that you want to display on the y-axis should be the value in the `sql` parameter of the measure.\n- When you're using any formatted measure (a measure of `type: percent_of_total` or a measure with a `value_format_name` or `value_format` parameter), make sure to use the Liquid syntax for the rendered value `{{ field_name._rendered_value }}` (where `field_name` is the actual name of the measure or dimension).\n\nExample\n-------\n\n| **Note:** The example in this section extrapolates upon the example map **Total Gross Margin** grouped by **State** introduced earlier on this page.\n\nBy default, the tooltip for the visualization data points will include the values for **Total Gross Margin** and **State** . However, what if you wanted to provide users with additional information that is not indicated on the map or included in the Explore query? What if you wanted to include the value for a field called **Percent of Total Gross Margin** instead of **State** ? Including **Percent of Total Gross Margin** will help users understand how the **Total Gross Margin** value for an individual data point compares to the total gross margin across the data set.\n\nTo customize the tooltip, follow these steps: \n\n measure: total_gross_margin {\n type: sum\n value_format_name: decimal_2\n sql: ${gross_margin} ;;\n html: {{ rendered_value }} | {{percent_of_gross_margin._rendered_value }} of total ;;\n }\n\n1. In [**Development Mode**](/looker/docs/dev-mode-prod-mode#development_mode), navigate to the LookML definition for the field that you want to customize.\n\n You can navigate directly to a field's LookML definition [from an Explore](/looker/docs/creating-and-editing-explores#features_for_developers).\n2. Determine the fields and values that you want to include in the tooltip in addition to the original field. For example, **Percent of Total Gross Margin**.\n\n3. Add an `html` parameter to the original measure that is referenced in the Explore query and displayed in the tooltip. In this case, the measure that is currently in the Explore query and displayed in the tooltip is **Total Gross Margin**.\n\n4. In the `html` parameter, create an expression with Liquid variables that appends the additional fields to the existing measure's value.\n\n - This example uses the Liquid variable `_rendered_value` to display [Looker formatted values](/looker/docs/reference/param-field-value-format-name). For example, `total_gross_margin` uses Looker formatting for two decimals, and `percent_of_total_gross_margin` uses Looker formatting for percentage with two decimals.\n - You can use a pipe character,`|`, to separate the values for different fields.\n - You can also append other words that might clarify the meaning of the other values that are rendered in the tooltip. In this case, `of total` is added to clarify what the percentage value means.\n5. Save, validate, and push your code to production after verifying that it works as expected.\n\n| **Note:** The input of the `html` parameter only impacts how the value is rendered to users. It does *not* change the underlying value in the database.\n\nThe tooltip will now display two values when a user hovers over a data point with the tooltip: the `total_gross_margin` value of the data point, and the corresponding `percent_of_total_gross_margin` value.\n\nNext steps\n----------\n\nOnce you have created your visualization with a customized tooltip, you can share it with others:\n\n- [Save your Explore as a Look](/looker/docs/saving-and-editing-looks)\n- [Add the Explore to a dashboard](/looker/docs/creating-user-defined-dashboards#adding_query_tiles_from_an_explore)\n- [Share the Explore with a URL](/looker/docs/sharing-urls)"]]