This page describes how to use the Query insights dashboard to detect and analyze Spanner performance problems.
Query insights overview
Query insights helps you detect and diagnose query and
DML (INSERT, UPDATE, and DELETE) statement
performance problems for a Spanner database. It supports
intuitive monitoring and provides diagnostic information that helps you go
beyond detection to identify the root cause of performance problems.
Query insights helps you improve Spanner query performance by guiding you through the following steps:
- Determine whether inefficient queries are causing high CPU utilization.
- Identify a potentially problematic query or tag.
- Analyze the query or request tag to identify issues.
Query insights is available in single-region and multi-region configurations.
Pricing
There is no additional cost for Query insights.
Data retention
Query insights retains data for a maximum of 30 days.
For the Total CPU Utilization (per Query or Request tag) graph, Spanner retrieves data from the SPANNER_SYS.QUERY_STATS_TOP_* tables. These tableshave a maximum
retention of 30 days. See Data retention
to learn more.
Required roles
You need different IAM roles and permissions depending on whether you are an IAM user or a fine-grained access control user.
Identity and Access Management (IAM) user
To get the permissions that you need to view Query insights page, ask your administrator to grant you the following IAM roles on the instance:
-
Cloud Spanner Viewer (
roles/spanner.viewer) -
Cloud Spanner Database Reader (
roles/spanner.databaseReader)
The following permissions in the Cloud Spanner Database Reader(
roles/spanner.databaseReader)
role are required to view the Query insights page:
spanner.databases.beginReadOnlyTransactionspanner.databases.selectspanner.sessions.create
Fine-grained access control user
If you are a fine-grained access control user, verify that you:
- Have the Cloud Spanner Viewer(
roles/spanner.viewer) - Have fine-grained access control privileges and are granted the
spanner_sys_readersystem role or one of its member roles. - Select the
spanner_sys_readeror a member role as your current system role on the database overview page.
For more information, see About fine-grained access control and Fine-grained access control system roles.
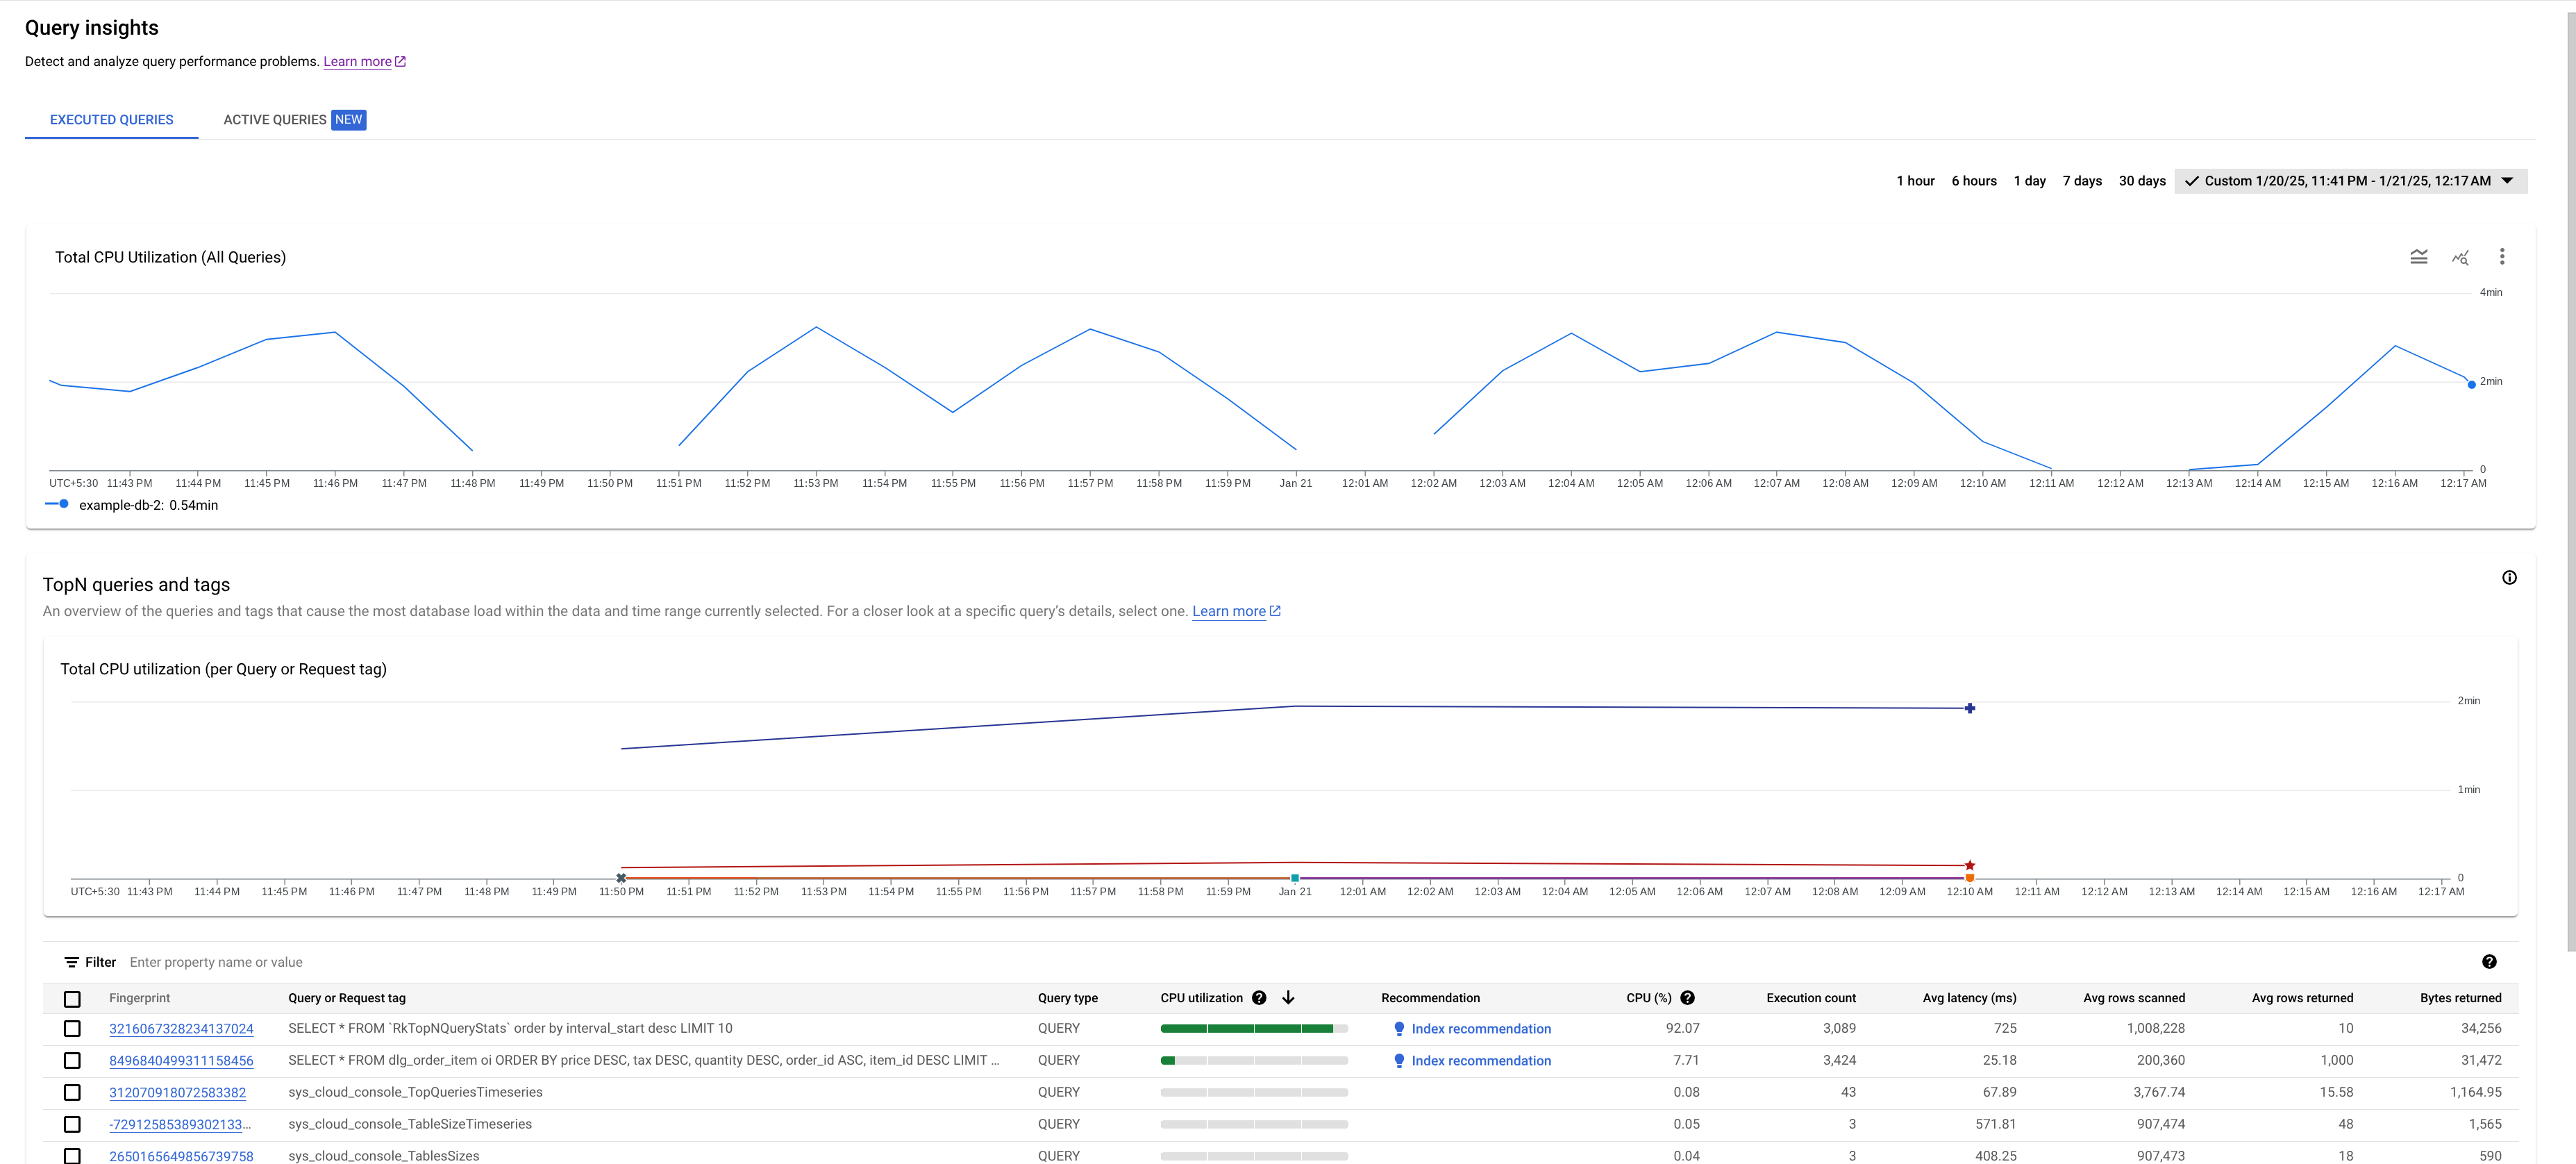
The Query insights dashboard
The Query insights dashboard shows the query load based on the database and time range that you select. Query load is a measurement of the total CPU utilization for all the queries in the instance in the selected time range. The dashboard provides a series of filters that help you view the query load.
To view the Query insights dashboard for a database, do the following:
- Select Query insights in the left navigation panel. The Query insights dashboard opens.
- Select a database from the Databases list. The dashboard shows the query load information for the database.
The areas of the dashboard include:
- Databases list: Filters the query load on a specific database or all databases.
- Time range filter: Filters the query load by time ranges, such as hours, days, or a custom range.
- Total CPU Utilization (All queries) graph: Displays the aggregated load of all queries.
- Total CPU Utilization (per Query or Request tag) graph: Displays the CPU utilization by each query or request tag.
- TopN queries and tags table: Displays the list of top queries and request tags sorted by CPU utilization. See Identify a potentially problematic query or tag.
Dashboard performance
Use query parameters or tag your queries to optimize Query insights performance. If you don't parameterize or tag your queries, then too many results might return, which might cause the TopN queries and tags table to not load properly.
Confirm if inefficient queries are responsible for high CPU utilization
Total CPU Utilization is a measure of the work (in CPU seconds) that the executed queries in your selected database perform over time.
Review the graph to explore these questions:
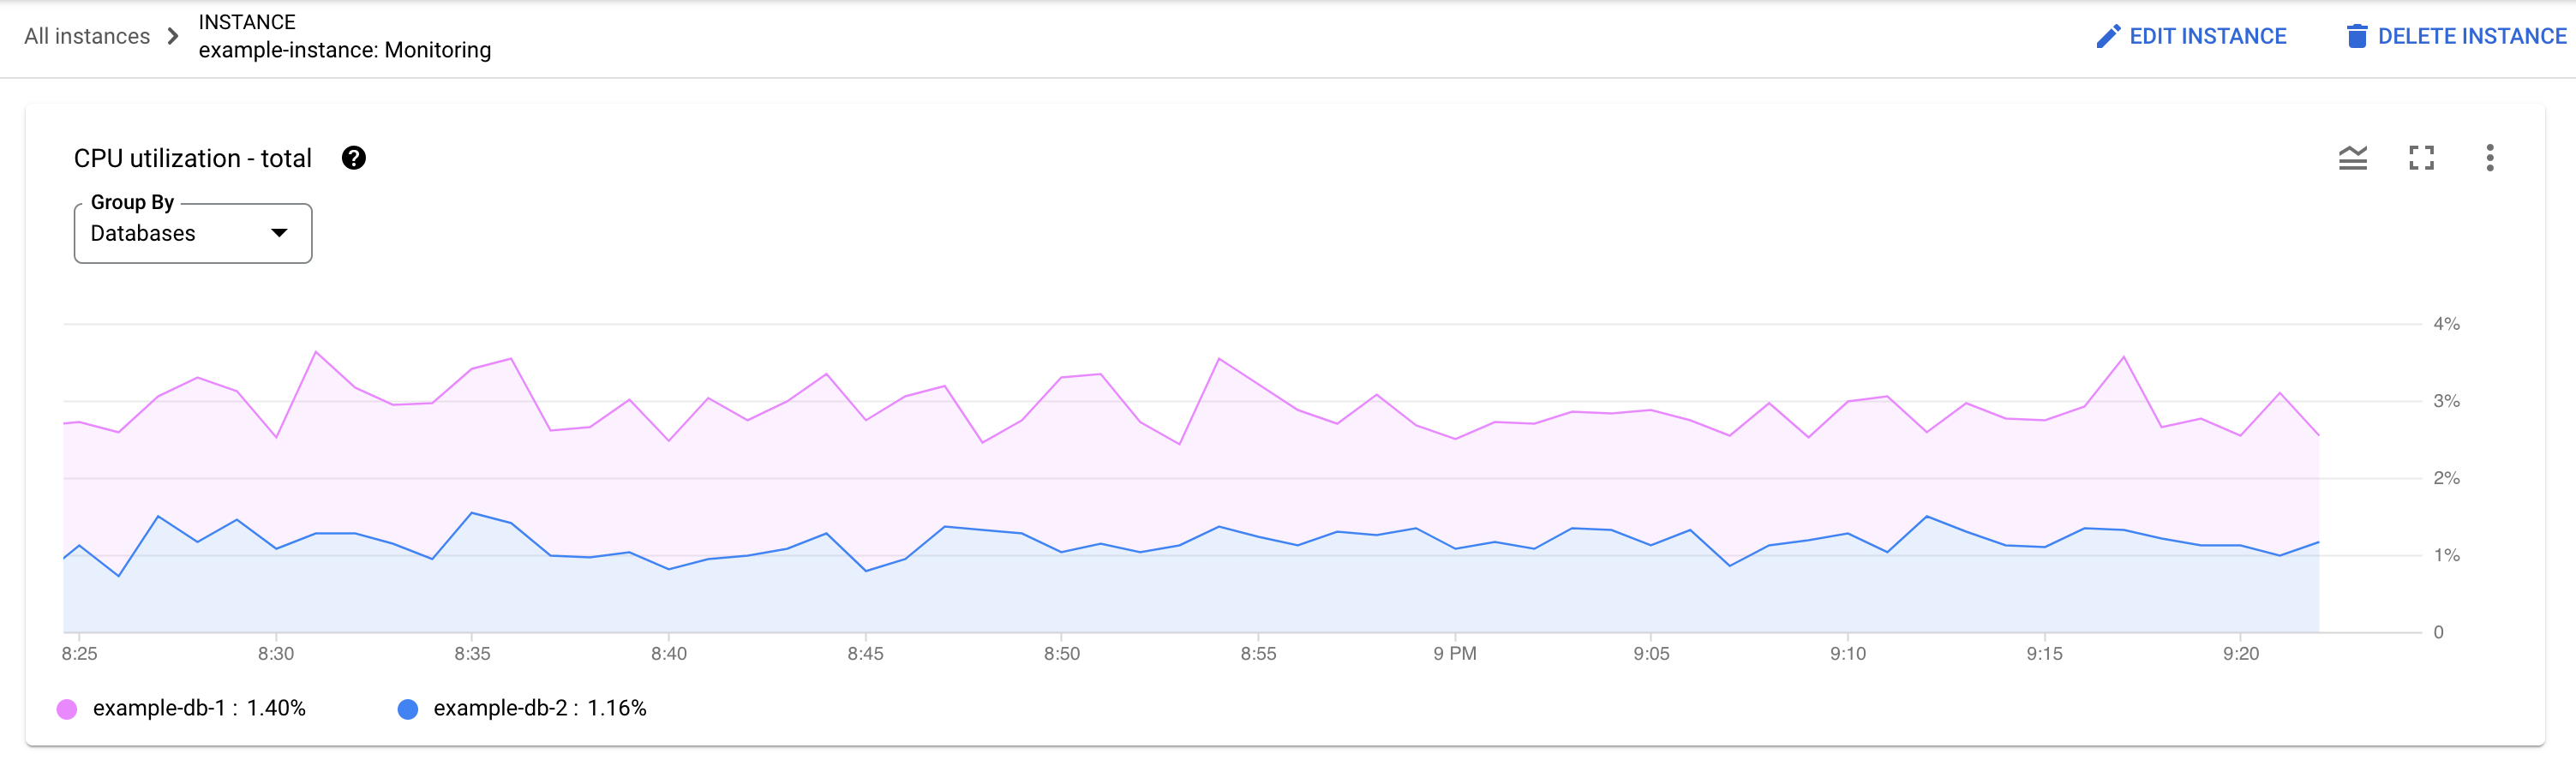
Which database is experiencing the load? Select different databases from the Databases list to find the databases with the highest loads. To find out which database has the highest load, you can also review the CPU utilization - total chart for databases in the Google Cloud console.
Is the CPU utilization high? Is the graph spiking or elevated over time? If you don't see high CPU utilization, then the problem isn't with your queries.
How long has the CPU utilization been high? Did it spike recently or has it consistently been high for some time? Use the range selector to select various time periods to find out how long the problem has lasted. Zoom in to view a time window where the query load spikes are observed. Zoom out to view up to one week of the timeline.
If you see a spike or an elevation in the graph corresponding to the overall instance CPU usage, then it is most likely due to one or more expensive queries. Next, you can dive deeper into the debugging journey by identifying a potentially problematic query or request tag.
Identify a potentially problematic query or request tag
To identify a potentially problematic query or request tag, observe the TopN queries section:
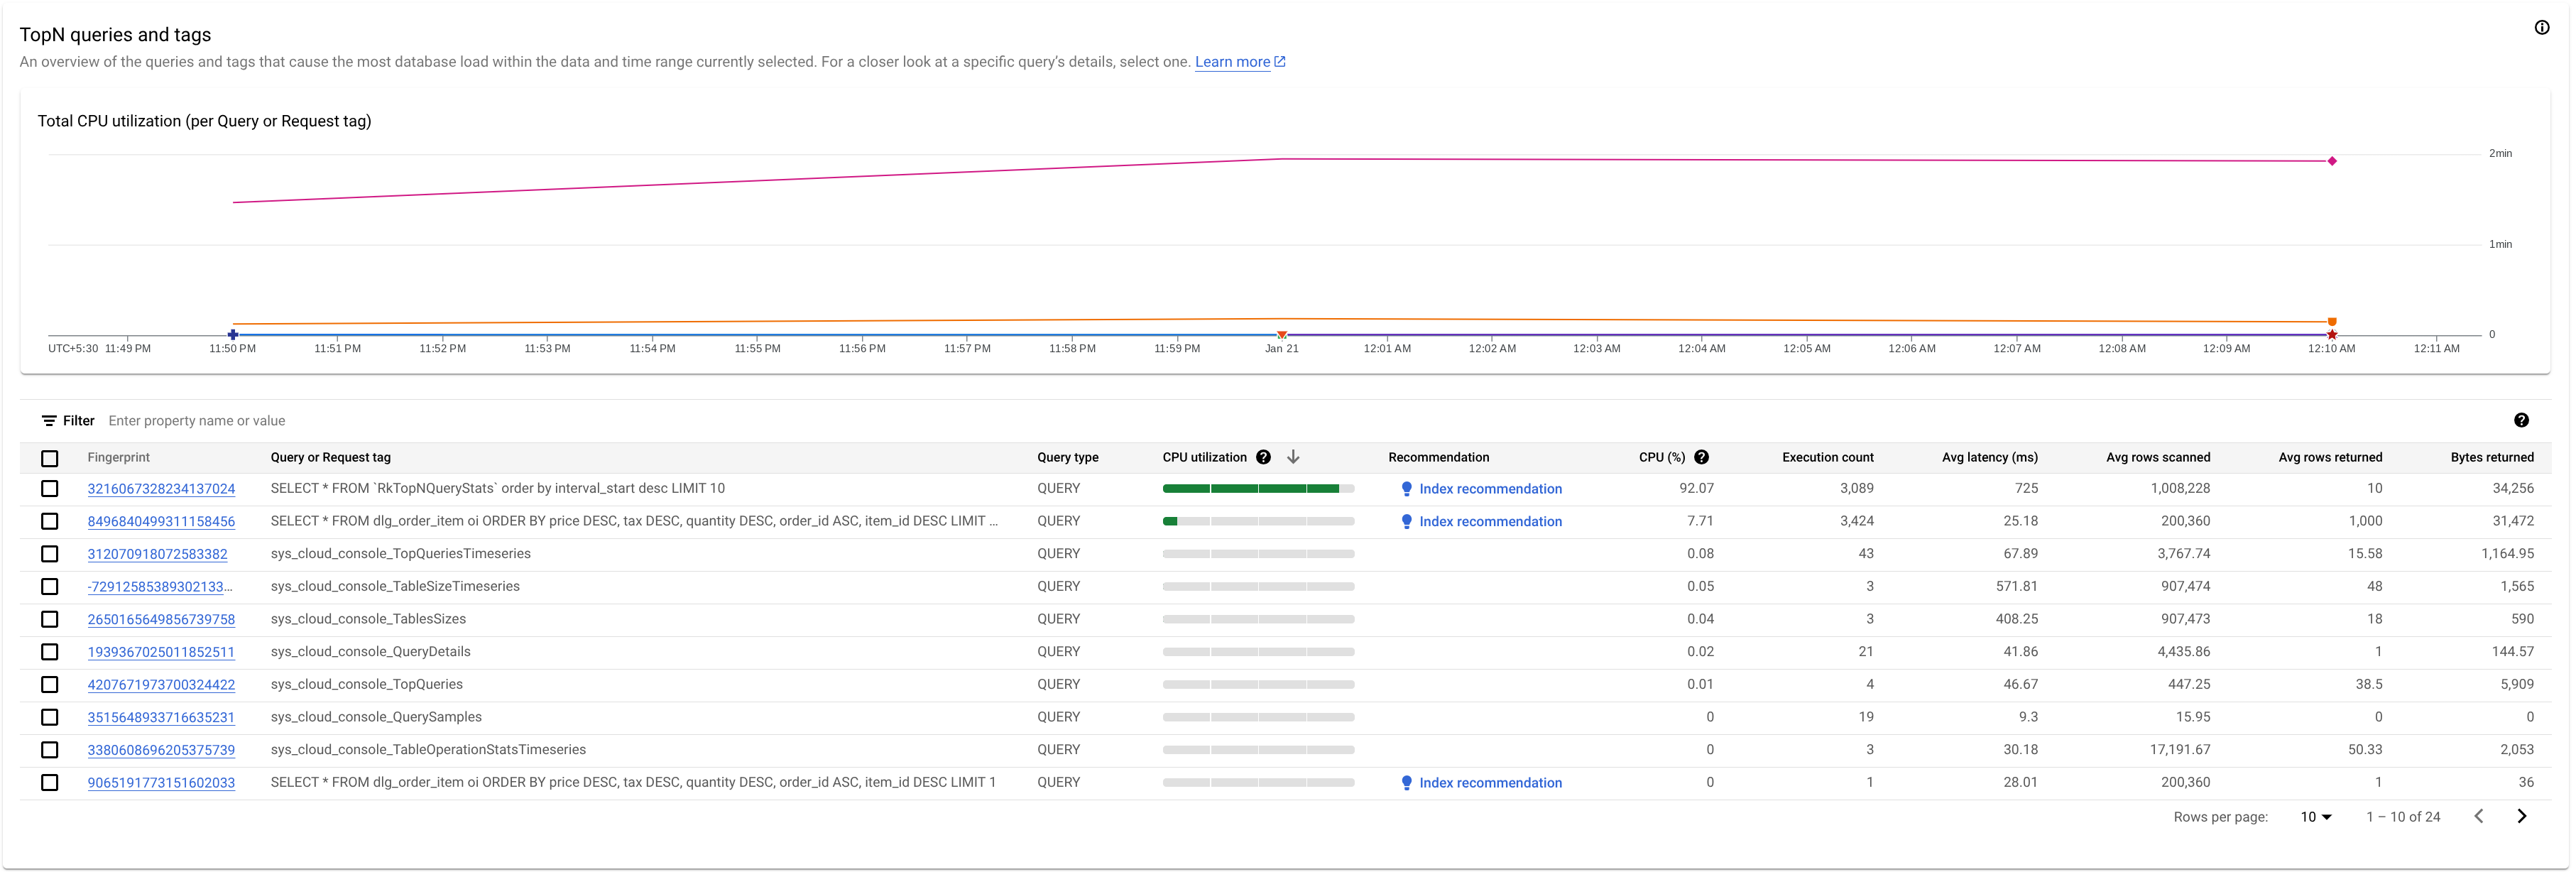
Here we see that the query with the fingerprint 3216067328234137024 has a high
CPU utilization and can be problematic.
The TopN queries table provides an overview of the queries that use the most CPU during the chosen time window, sorted from highest to lowest. The number of TopN queries are limited to 100.
For the graphs, we fetch the data from the TopN query statistics table, which has three different granularities: 1 min, 10 min, and 1 hour. The value for each data point in the graphs represents the average value over an interval of one minute.
We recommend that you add tags to your SQL queries. Query tagging helps you find issues at higher-level constructs, such as with the business logic or a microservice.
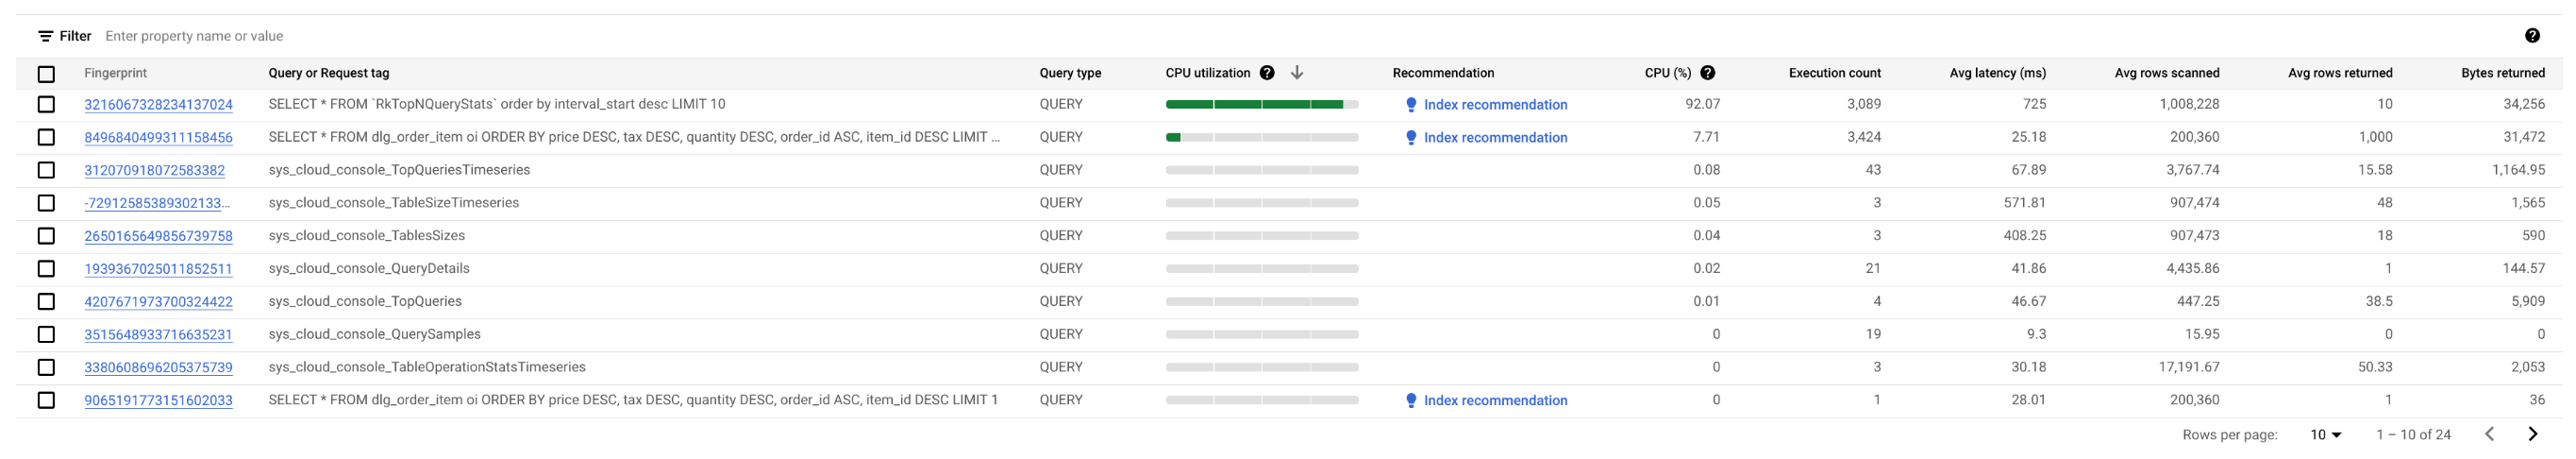
The table shows the following properties:
- Fingerprint: Hash of the request tag, or if the tag isn't present, a hash of the query text.
Query or Request tag: If the query has a tag associated along with it, the Request tag is shown. Statistics for multiple queries that have the same tag string are grouped in a single row with the
REQUEST_TAGvalue matching the tag string. To learn more about using request tags, see Troubleshooting with request tags and transaction tags.If the query does not have an associated tag, the SQL query, truncated to approximately 64KB, is shown. For batch DML, the SQL statements are flattened into a single row and concatenated, using a semicolon delimiter. Consecutive identical SQL texts are deduplicated before truncating.
Query type: Indicates if a query is a
PARTITIONED_QUERYorQUERY. APARTITIONED_QUERYis a query with apartitionTokenobtained from the PartitionQuery API. All the other queries and DML statements are denoted by theQUERYquery type.CPU Utilization: CPU resource consumption by a query, as a percentage of the total CPU resources used by all the queries running on the databases in that time interval, shown on a horizontal bar having a range of 0 to 100.
Recommendation: Spanner analyzes your queries to determine if they can benefit from improved indexes. If so, it recommends new or altered indexes that can improve the query performance. For more information, see Use the Spanner index advisor.
CPU (%): CPU resource consumption by a query, as a percentage of the total CPU resources used by all the queries running on the databases in that time interval.
Execution count: Number of times Spanner saw the query during the interval.
Avg latency (ms): Average length of time, in microseconds, for each query execution within the database. This average excludes the encoding and transmission time for the result set as well as overhead.
Avg rows scanned: Average number of rows that the query scanned, excluding deleted values.
Avg rows returned: Average number of rows that the query returned.
Bytes returned: Number of data bytes that the query returned, excluding transmission encoding overhead.
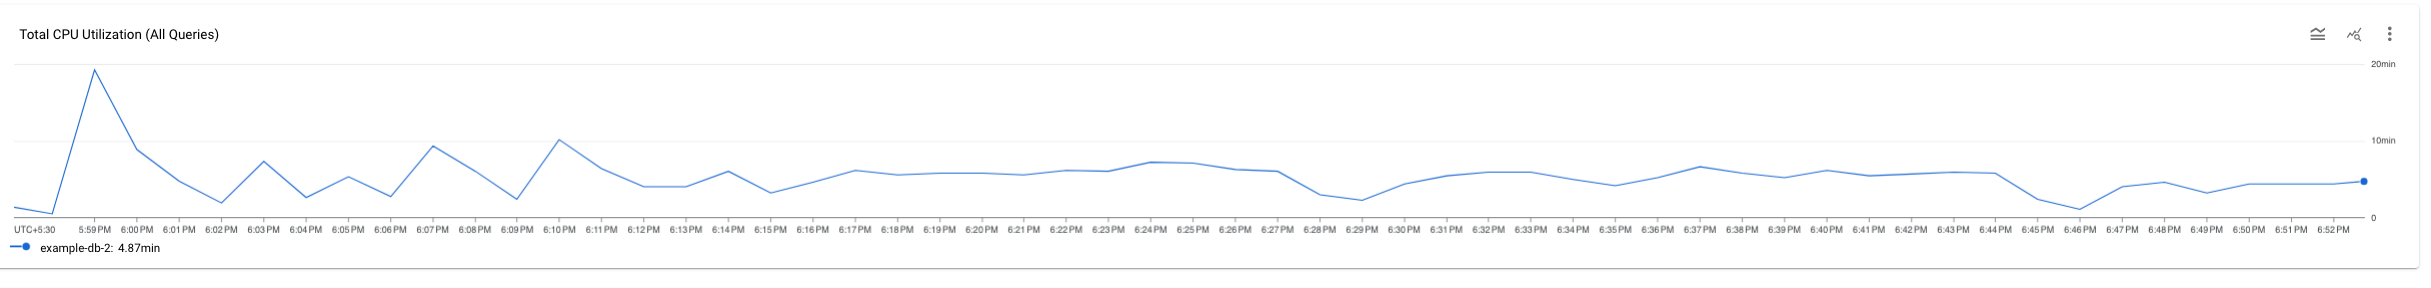
Possible variance between the graphs
You might notice some variance between the Total CPU Utilization (all queries) graph and the Total CPU Utilization (per Query or Request tag) graph. There are two things that could lead to this scenario:
Different sources of data: The Cloud Monitoring data, which feeds the Total CPU Utilization (all queries) graph, is usually more accurate because it's pushed every minute and has a retention period of 45 days. On the other hand, the system table data, which feeds the Total CPU Utilization (per Query or Request tag) graph might be averaged over 10 mins (or 1 hour) in which case we might lose high granularity data we see in the Total CPU Utilization (all queries) graph.
Different aggregation windows: Both graphs have different aggregation windows. For example, when inspecting an event older than 6 hours, we would query the
SPANNER_SYS.QUERY_STATS_TOTAL_10MINUTEtable. In this case, an event that occurs at 10:01 would get aggregated over 10 minutes and would be present in the system table corresponding to the 10:10 timestamp.
The following screenshot shows an example of such variance.
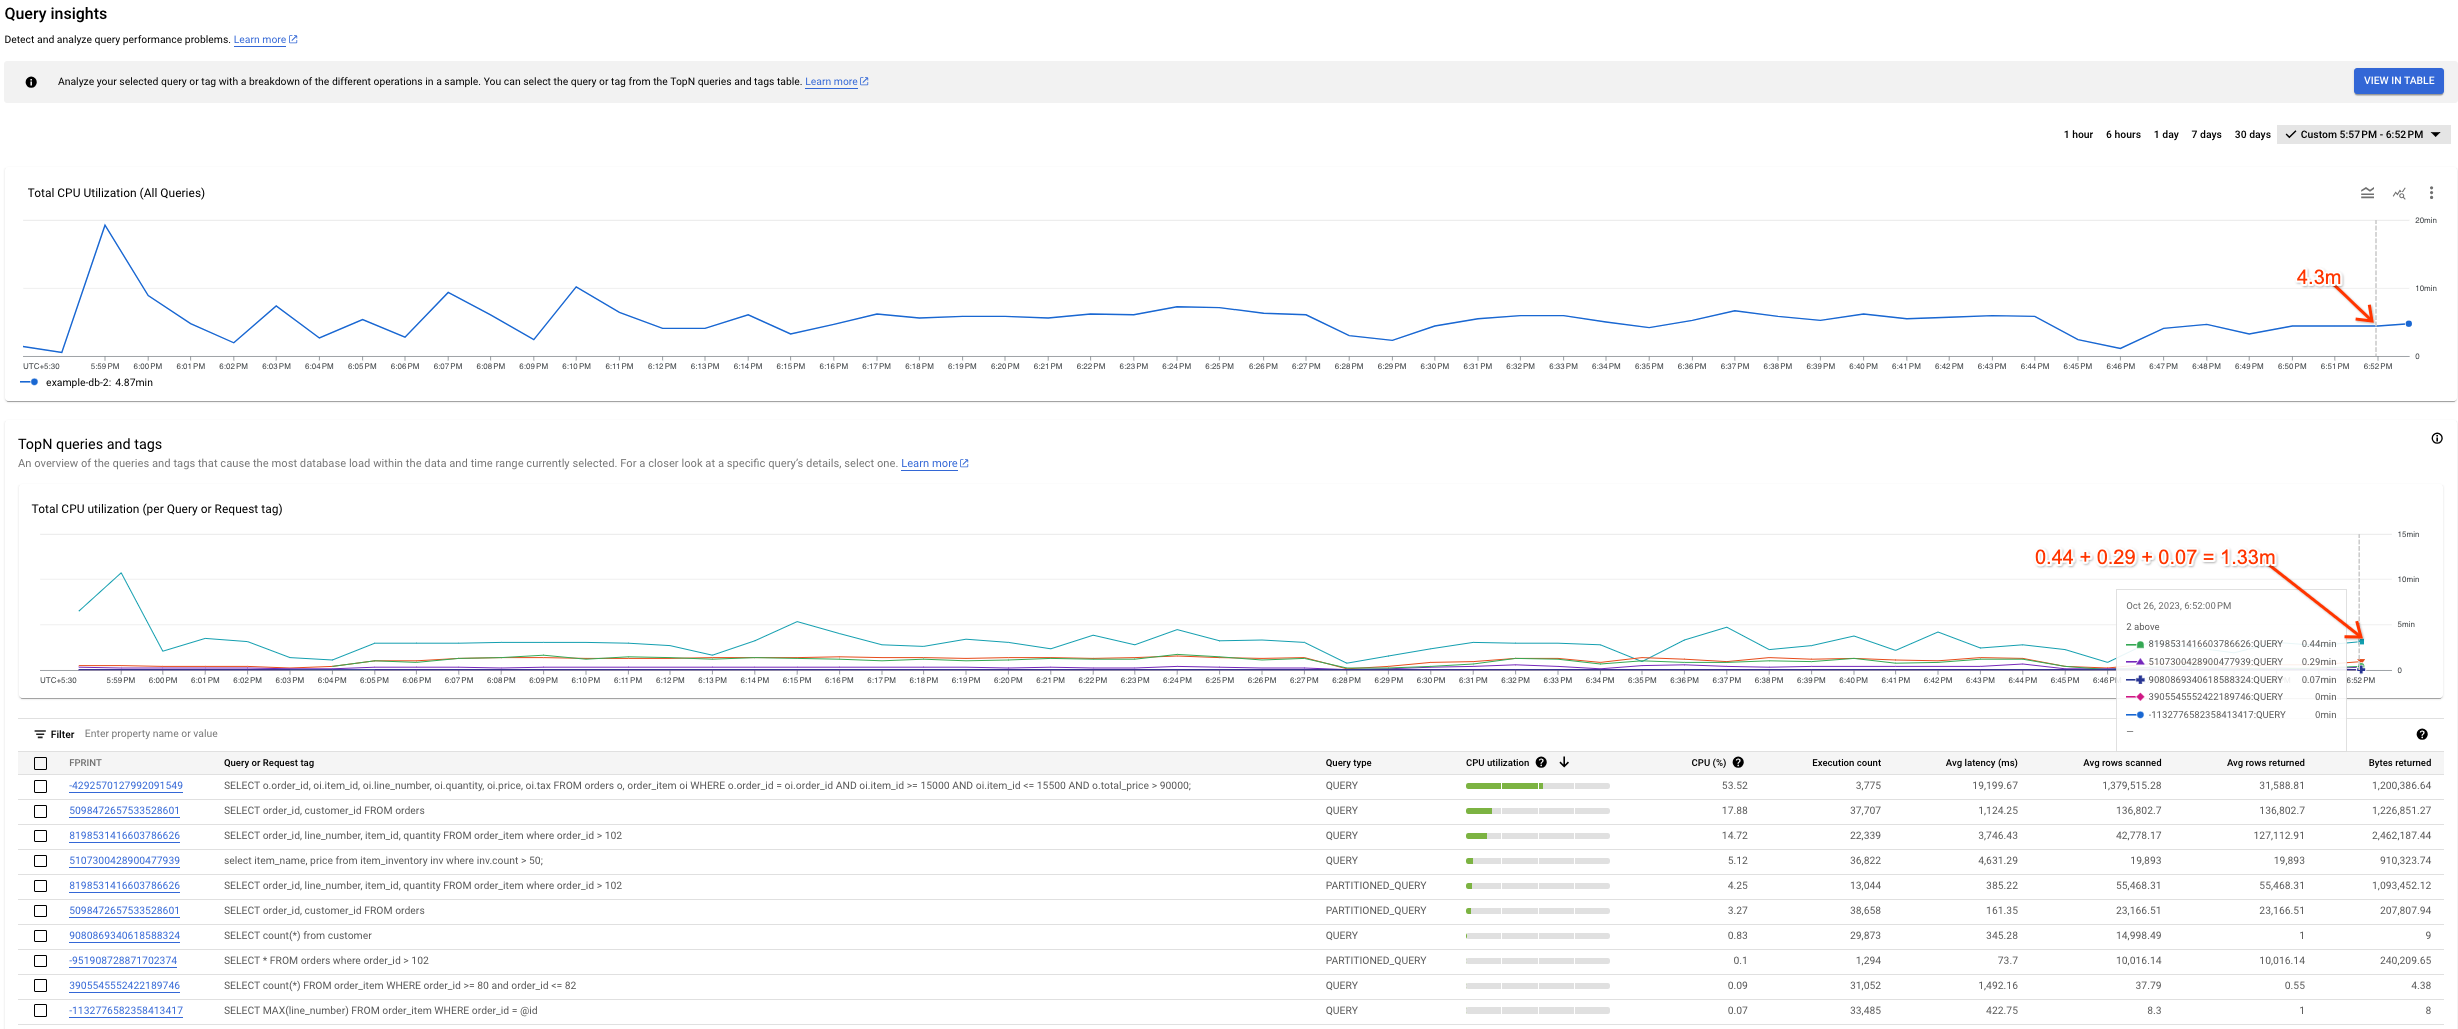
Analyze a specific query or request tag
To determine if a query or request tag is the root cause of the problem, click the query or request tag that looks like it has the highest load or is taking a longer time than the others. You can select multiple queries and request tags at a time.
You can hold the mouse pointer on the graph for queries across the timeline to know their CPU utilization (in seconds).
Try to narrow down the problem by looking at the following:
- How long has the load been high? Is it only high now? Or has it been high for a long time? Change the time ranges to find the date and time where the query started performing poorly.
- Were there spikes in CPU utilization? You can change the time window to study the historical CPU utilization for the query.
- What is the resource consumption? How does it relate to other queries? Look at the table and compare the data of other queries with the selected one. Is there a major difference?
To confirm that the selected query is contributing to the high CPU Utilization, you can drill down into the details of the specific query shape (or request tag) and analyze it further on the Query Details page.
View the Query Details page
To view the details of a specific query shape or request tag in a graphical form, click the fingerprint associated with the query or request tag. The Query Details page opens.
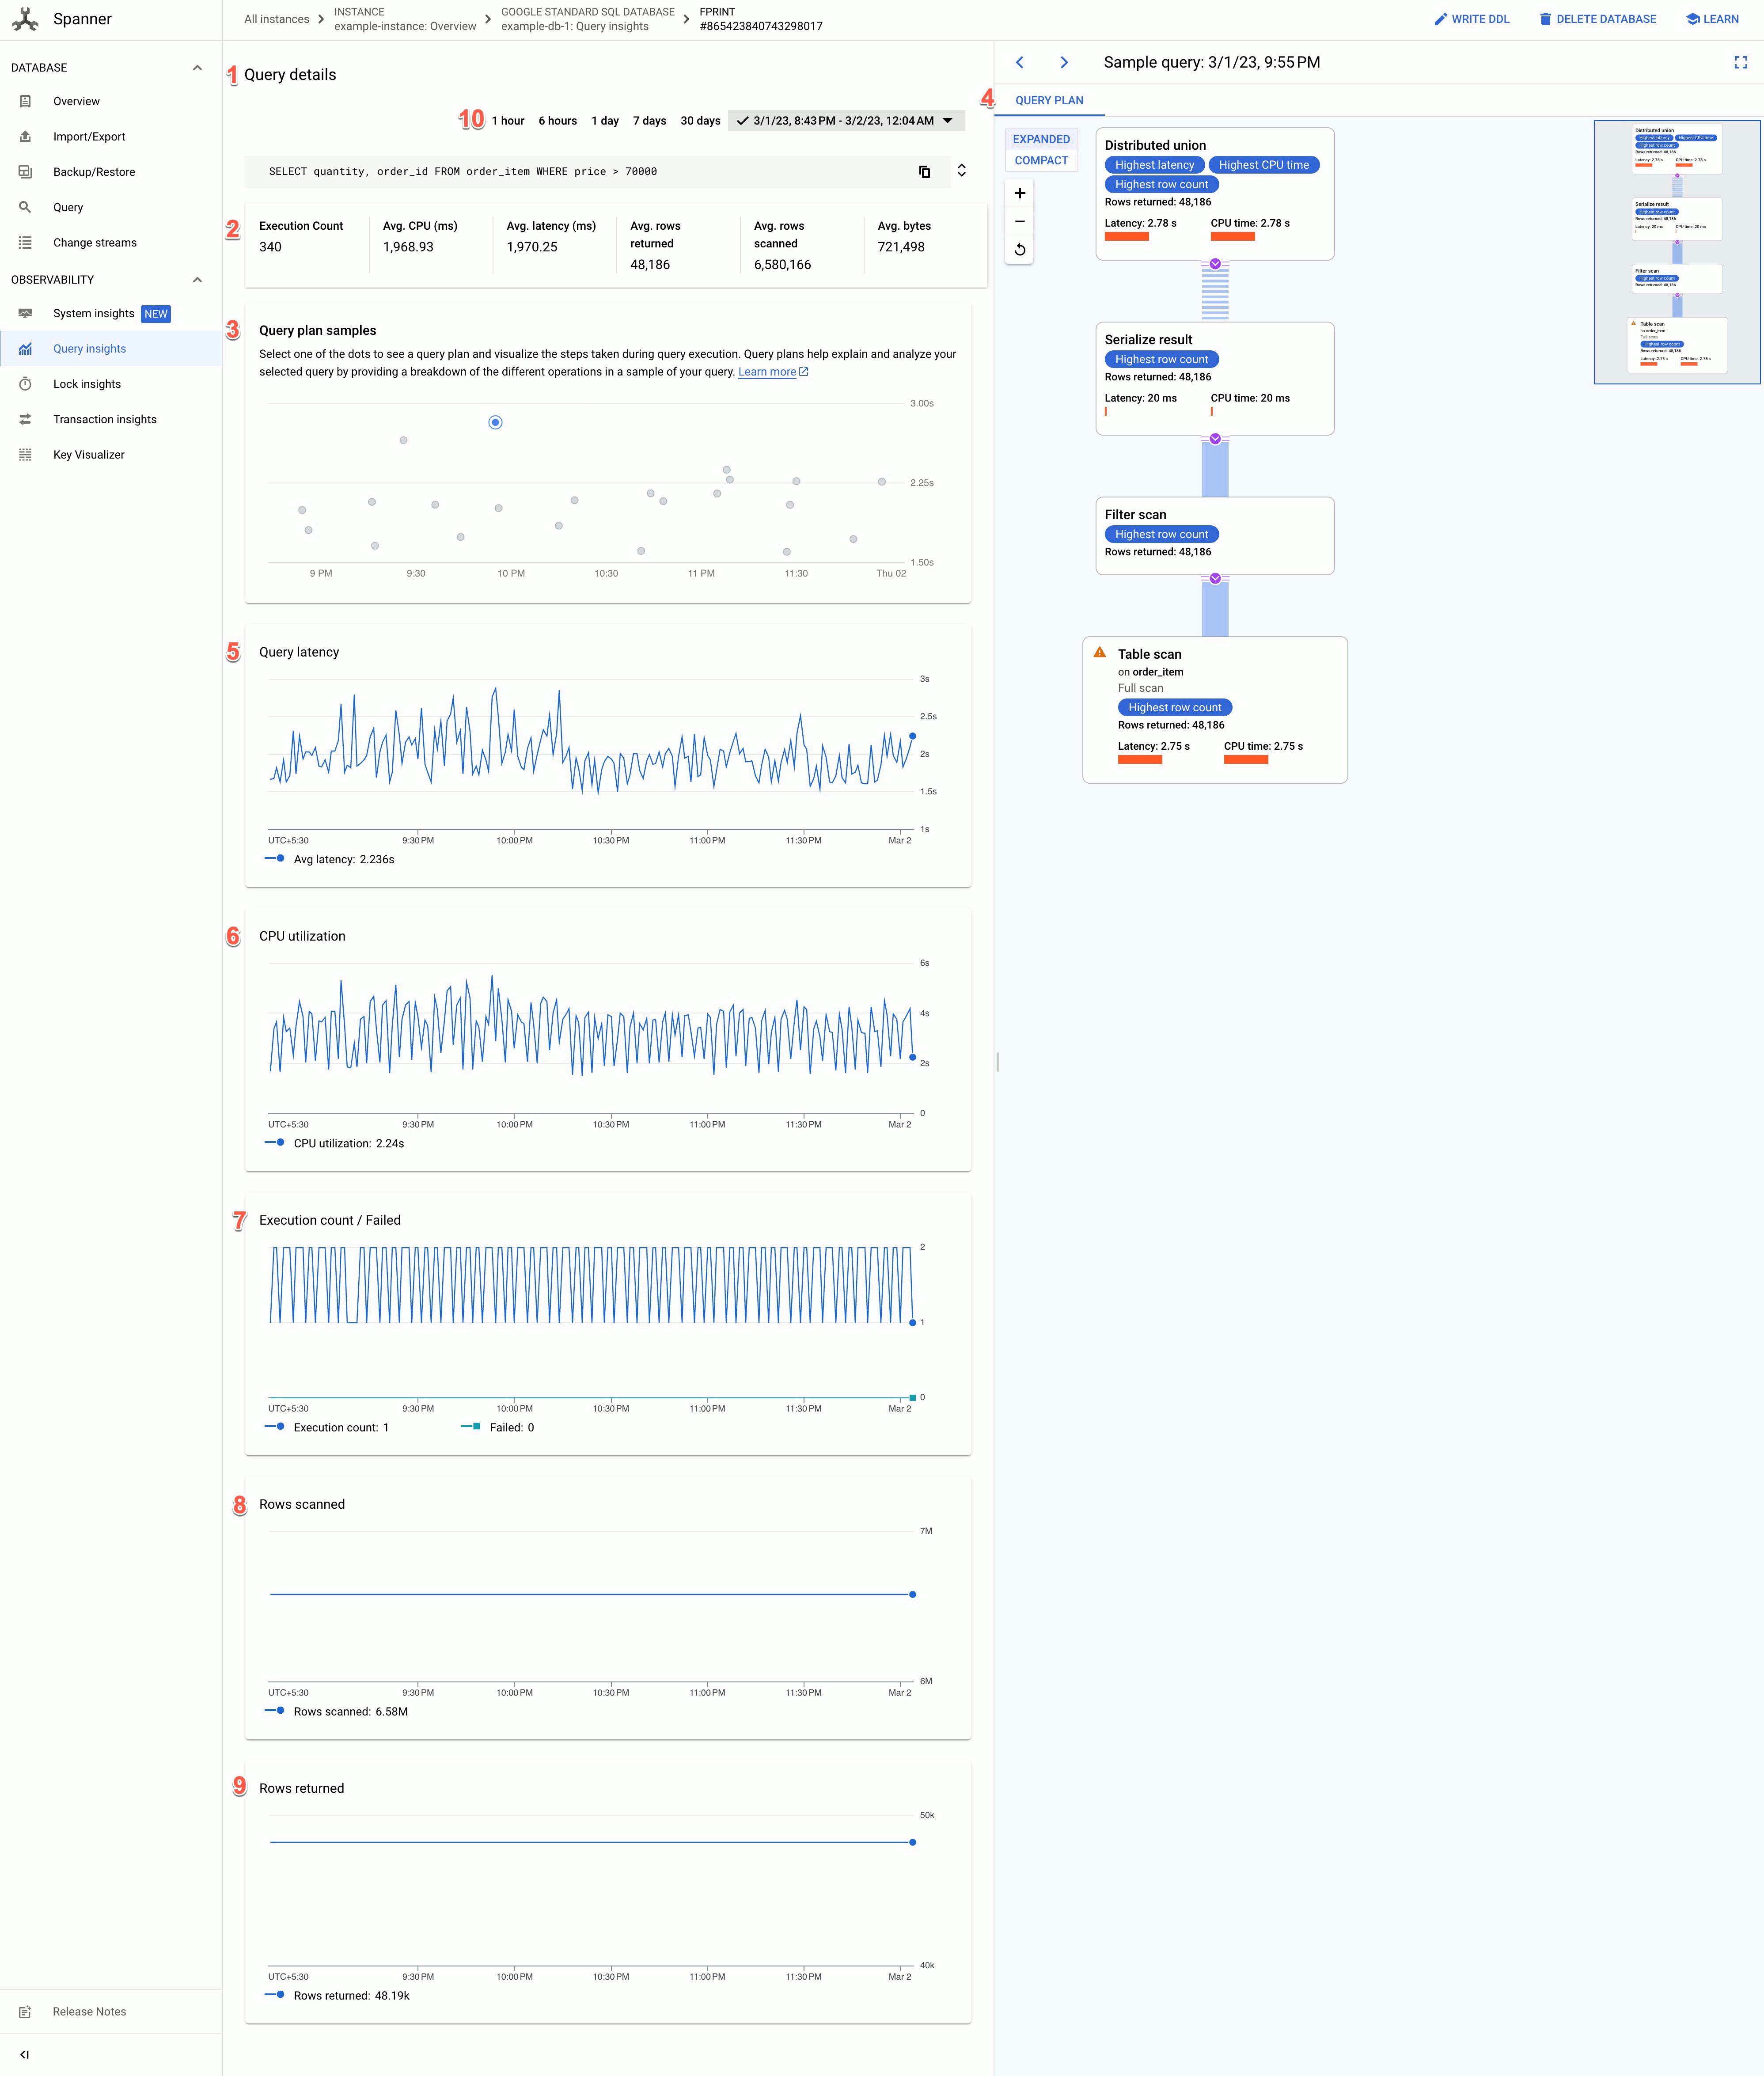
The Query Details page shows the following information:
- Query details text: SQL query text, truncated to approximately 64KB. Statistics for multiple queries that have the same tag string are grouped in a single row with the REQUEST_TAG matching that tag string. Only the text of one of those queries is shown in this field. For batch DML, the set of SQL statements are flattened into a single row, concatenated using a semicolon delimiter. Consecutive identical SQL texts are deduplicated before truncating.
- The values of the following fields:
- Execution count: Number of times Spanner saw the query during the interval.
- Avg. CPU (ms): Average CPU resource consumption, in milliseconds, by a query of the instance's CPU resources in a time interval.
- Avg. Latency (ms): Average length of time, in milliseconds, for each query execution within the database. This average excludes the encoding and transmission time for the result set and overhead.
- Avg. rows returned: Average number of rows that the query returned.
- Avg. rows scanned: Average number of rows that the query scanned, excluding deleted values.
- Avg. bytes: Number of data bytes that the query returned, excluding transmission encoding overhead.
- Query plans samples graph: Each dot on the graph represents a sampled query plan at a specific time and its specific query latency. Click one of the dots in the graph to view the query plan and visualize the steps taken during the query execution. Note: Query plans are not supported for queries with partitionTokens obtained from the PartitionQuery API and Partitioned DML queries.
- Query plan visualizer: Shows the sampled query plan selected. Each node, or card, on the graph represents an iterator that consumes rows from its inputs and produces rows to its parent. You can click each iterator for expanded information.
- Query latency graph: Shows the value of query latency for a selected query over a time period. It also shows the average latency.
- CPU Utilization graph: Shows the CPU utilization by a query, in percentage, over a time period. It also shows the average CPU utilization.
- Execution count/failed graph: Shows the execution count of a query over a time period and the number of times the query execution failed.
- Rows scanned graph: Shows the number of rows that the query scanned over a time period.
- Rows returned graph: Shows the number of rows that the query returned over a time period.
- Time range filter: Filters query details by time ranges, such as hour, day, or a custom range.
For the graphs, we fetch the data from the TopN query statistics table, which has three different granularities: 1 min, 10 min, and 1 hour. The value for each data point in the graphs represents the average value over an interval of one minute.
Search for all executions of a query in the audit log
To search for all executions of a particular query fingerprint in
Cloud Audit Logs,
query the audit log and search for any
query_fingerprint matching the Fingerprint field in the TopN query statistics
table. For more information, see the Query and view logs overview. Use this method to identify the user who initiated the query.