This page describes how to use Lock insights and Transaction insights to identify transactions that lead to high latencies.
Overview
To ensure the consistency of multiple concurrent transactions, Spanner uses locks to control access to the data. Lock contention occurs when many transactions require frequent access to the same lock, leading to high latencies. Without a visual interface, it can be tedious to identify the problematic transactions that lead to a high number of lock contention issues.
Spanner operations acquire locks when the operations are part of a read-write transaction. Read-only transactions don't acquire locks.
Spanner helps you identify transactions that lead to high latencies by guiding you through the following steps:
- Check for a spike in latencies using Spanner Monitoring.
- Check for lock contention issues using Lock insights.
- Identify problematic transactions using Transaction insights.
Pricing
There is no additional cost for Lock insights or Transaction insights.
Region configurations
Lock insights and Transaction insights are available in both regional and multi-region configurations.
Data retention
The maximum data retention for the data that's shown on the Lock insights
and Transaction insights dashboards is 30 days. For graphs, data is retrieved from
SPANNER_SYS.* tables, which have a maximum retention period of 30 days.
For more information about these tables and data retention, see Lock statistics and Transaction statistics.
Required roles
You need different IAM roles and permissions depending on whether you are an IAM user or a fine-grained access control user.
Identity and Access Management (IAM) user
To get the permissions that you need to view the Lock and Transaction insights page, ask your administrator to grant you the following IAM roles on the instance:
-
All:
-
Cloud Spanner Viewer (
roles/spanner.viewer) -
Cloud Spanner Database Reader (
roles/spanner.databaseReader)
-
Cloud Spanner Viewer (
The following permissions in the Cloud Spanner Database Reader (
roles/spanner.databaseReader) role are required to view the Lock and Transaction insights page:
spanner.databases.beginReadOnlyTransactionspanner.databases.selectspanner.sessions.create
Fine-grained access control user
If you are a fine-grained access control user, ensure that you:
- Have the Cloud Spanner
Viewer(
roles/spanner.viewer)- Only have fine-grained access control privileges and are granted the
spanner_sys_readersystem role or one of its member roles.
- Only have fine-grained access control privileges and are granted the
- Select the
spanner_sys_readeror a member roles as your current system role on the database overview page.
For more information, see About fine-grained access control and Fine-grained access control system roles.
Check for a spike in latencies using Spanner Monitoring
You can use Cloud Monitoring to set alerts for metrics that exceed specified thresholds for all requests.
If you get an alert that indicates a spike in the latencies for an instance, you can confirm it on the Spanner Monitoring dashboard, which shows charts for various important metrics. The Latency chart helps you view high latencies at the 50th and 99th percentiles.
To confirm a spike in write latencies at the 99th percentile, follow these steps:
In the Google Cloud console, go to the Spanner Instances page.
Click the name of the instance.
The Google Cloud console displays an overview of the instance.
Click Monitoring on the navigation menu.
The Google Cloud console displays charts of data for the instance.
On the Latency chart, set Function to
Writeand Percentile to99th.Check the refreshed chart to check if it shows any spikes.
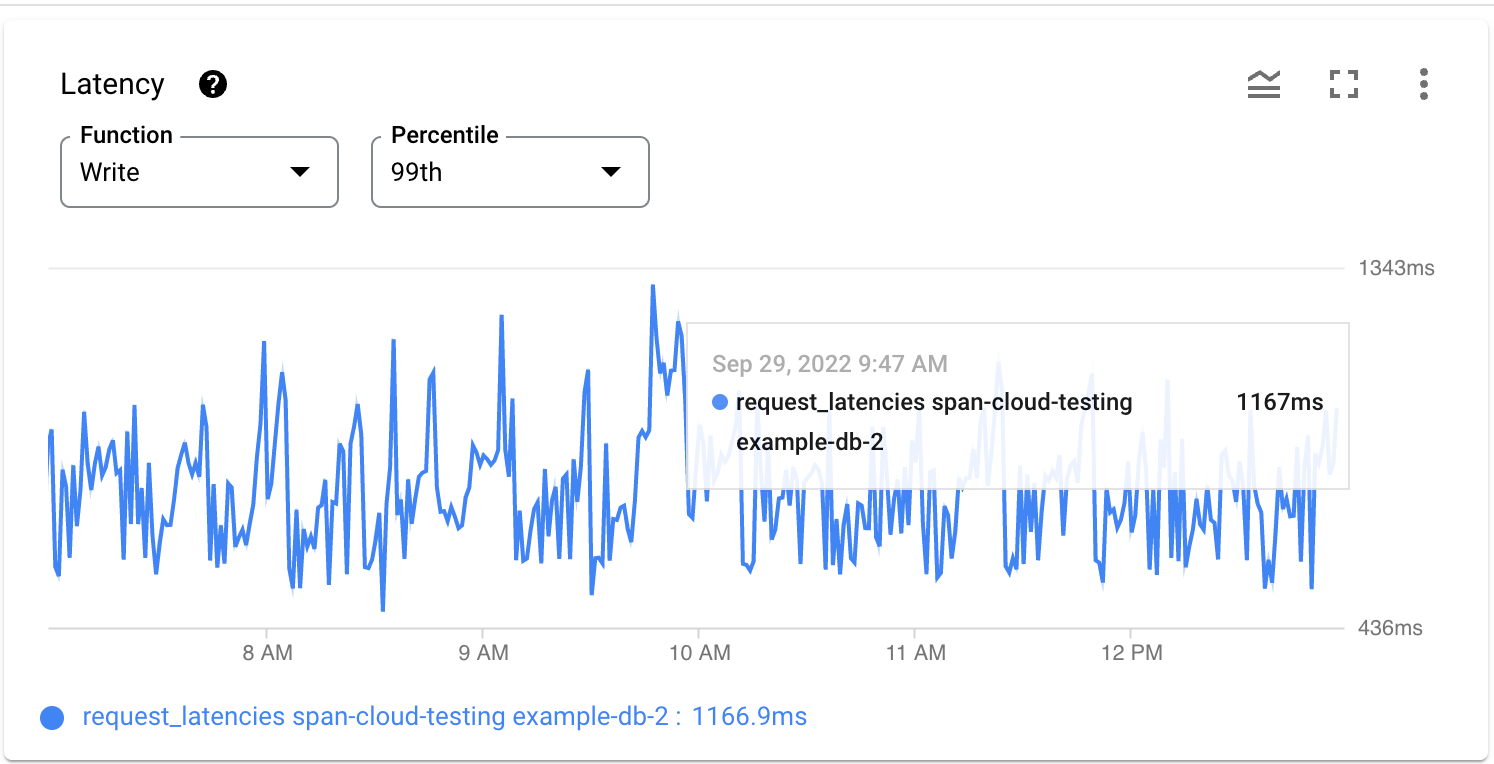
If you observe that CPU utilization is not spiking and errors spike in operations per second, it's probable that latency spikes are due to the lock contentions.
Check for lock contention issues using Lock insights
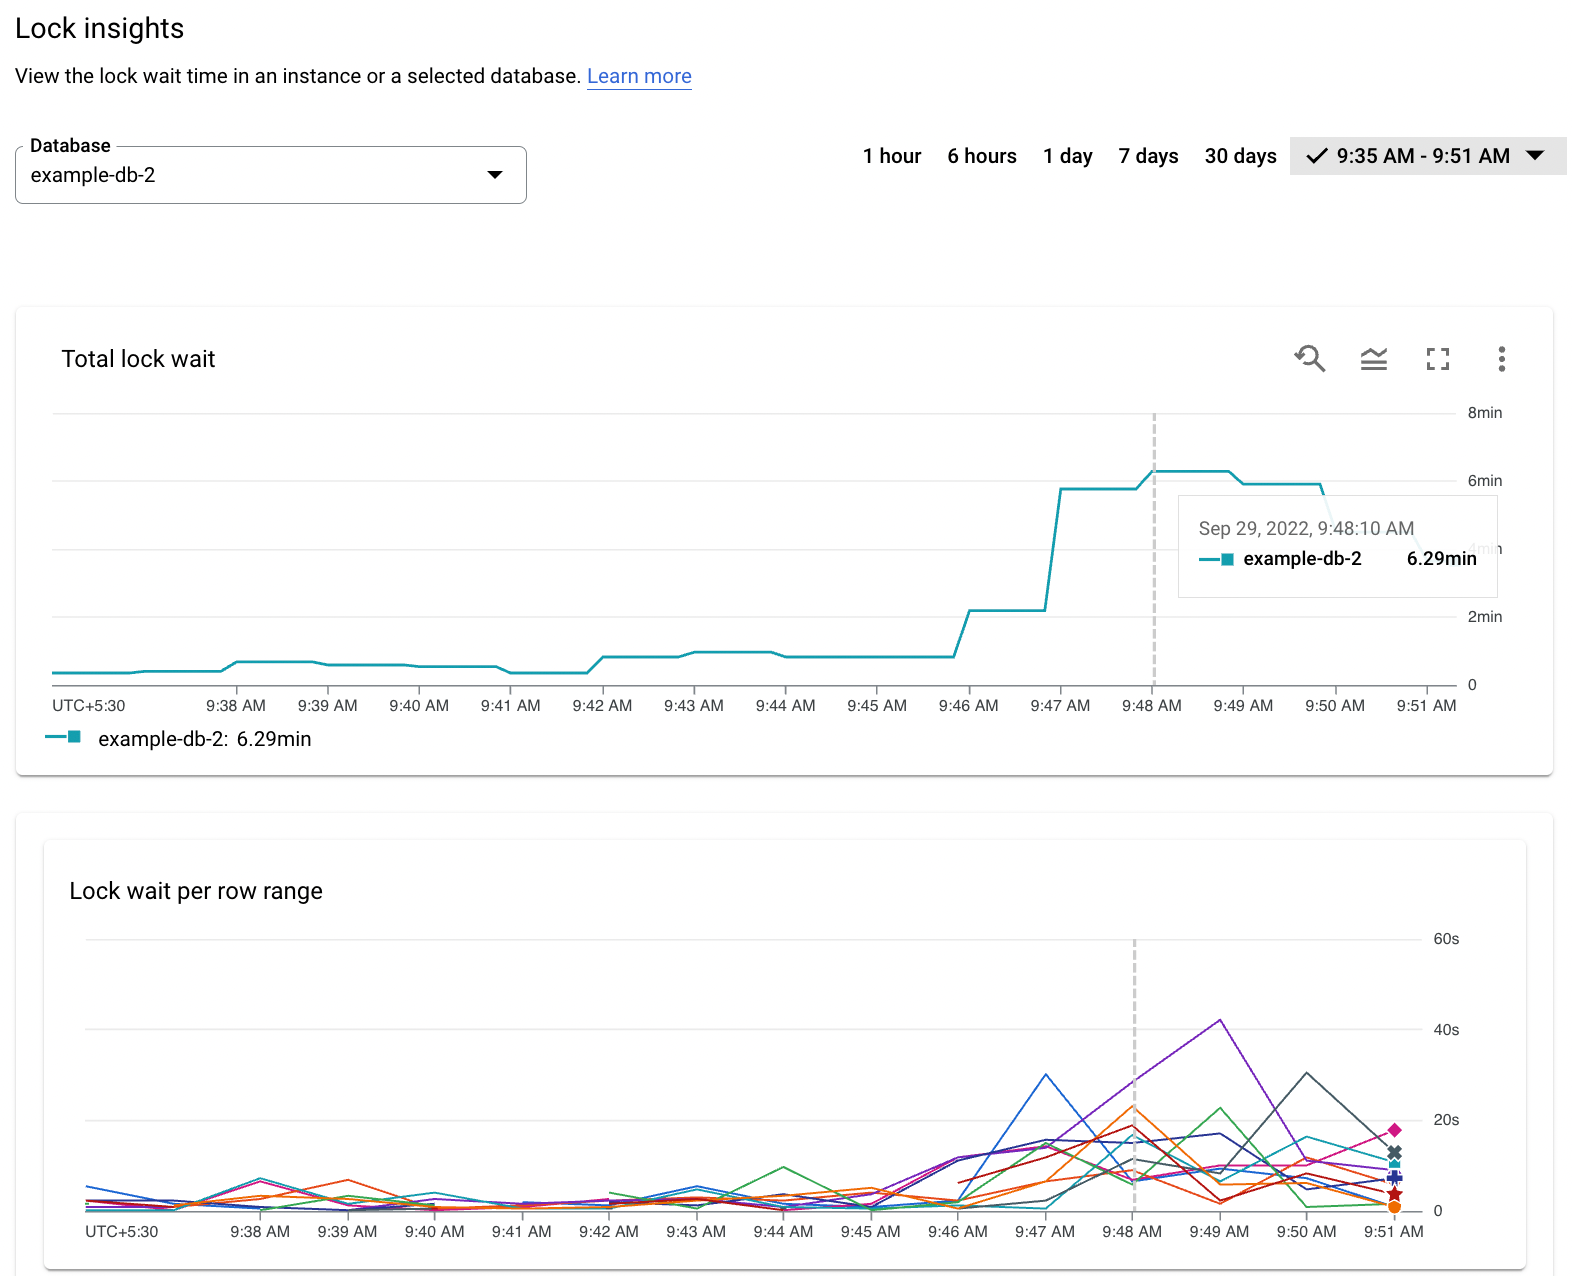
The Lock insights dashboard helps you view the lock wait time in an instance or a selected database. It can help you confirm if high latencies are due to lock contentions.
Check for high lock wait time
To check for high lock wait time, follow these steps:
Click Lock insights on the navigation menu.
The Google Cloud console displays the Total lock wait chart, which shows the lock wait time for each database in the instance.
The data shown is for
1 hourby default, as the time selector at the upper-right corner of the Lock insights dashboard shows. To see data for a wider range, select another option, such as1 day.For more information, see Working with charts.
From the Databases selector at the top, select the database that shows the highest lock wait time.
The Total lock wait chart refreshes to show data only for the selected database.
Additionally, another chart, Lock wait per row range, displays graphs for lock wait time by row ranges.
Click the graph and drag horizontally to expand the hour where a latency spike is visible.
Analyze the lock wait data
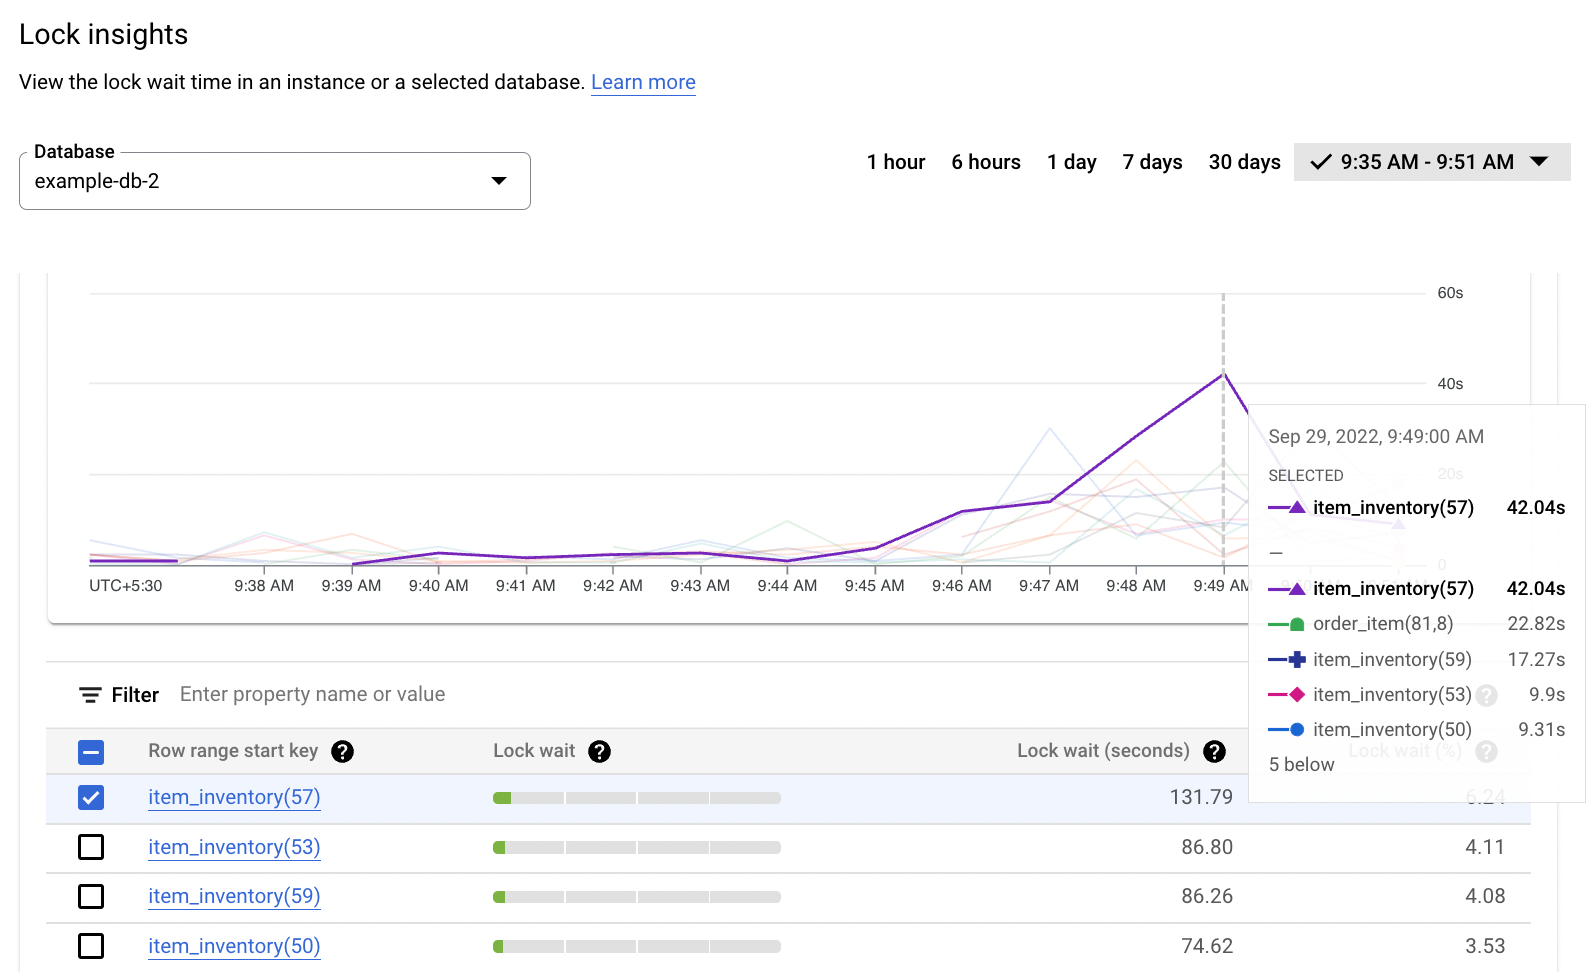
The Lock Insights table shows the following columns from the
SPANNER_SYS.LOCK_STATS system
tables:
- Row range start key: The row key where the lock conflict occurred. When
the conflict involves a range of rows, the value represents the start key of the
range. A plus sign (
+) signifies a range. - Lock wait: The total lock wait time visually represented on a horizontal bar. By default, the table uses this column for sorts and shows the row range start key with the highest lock wait time at the top.
- Lock wait (seconds): The cumulative lock wait time of lock conflicts recorded for all columns in the row key range, in seconds.
- Lock wait (%): The wait time of the lock conflicts recorded for all columns in the row key range as a percentage of the total lock wait time for all row key ranges in the database.
To correlate the data on the Lock wait per row range chart with the data in the table, select a line. The related row appears highlighted. Conversely, select the checkbox for a row in the table to see the related line on the chart.
To filter the data in the table, do the following:
Click in the field next to Filter.
Select a property, select an operator, and specify a value.
The table shows data matching the filter.
View sample lock requests
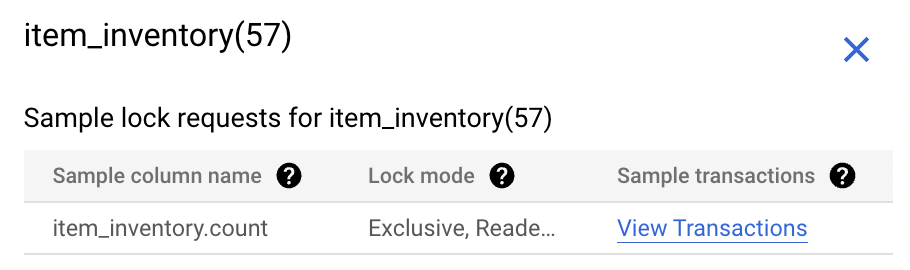
The Sample lock requests panel shows details about sample lock requests from contending transactions.
To view sample lock request information for a row range start key, click the related link in the table.
The table shows the following columns of information:
- Sample column name: The column that encountered the lock conflict on the row key range.
- Lock mode: The requested lock mode.
- View transactions: A link to the Transaction insights page, which shows the transactions that might be contending for locks.
Identify contending transactions using Transaction insights
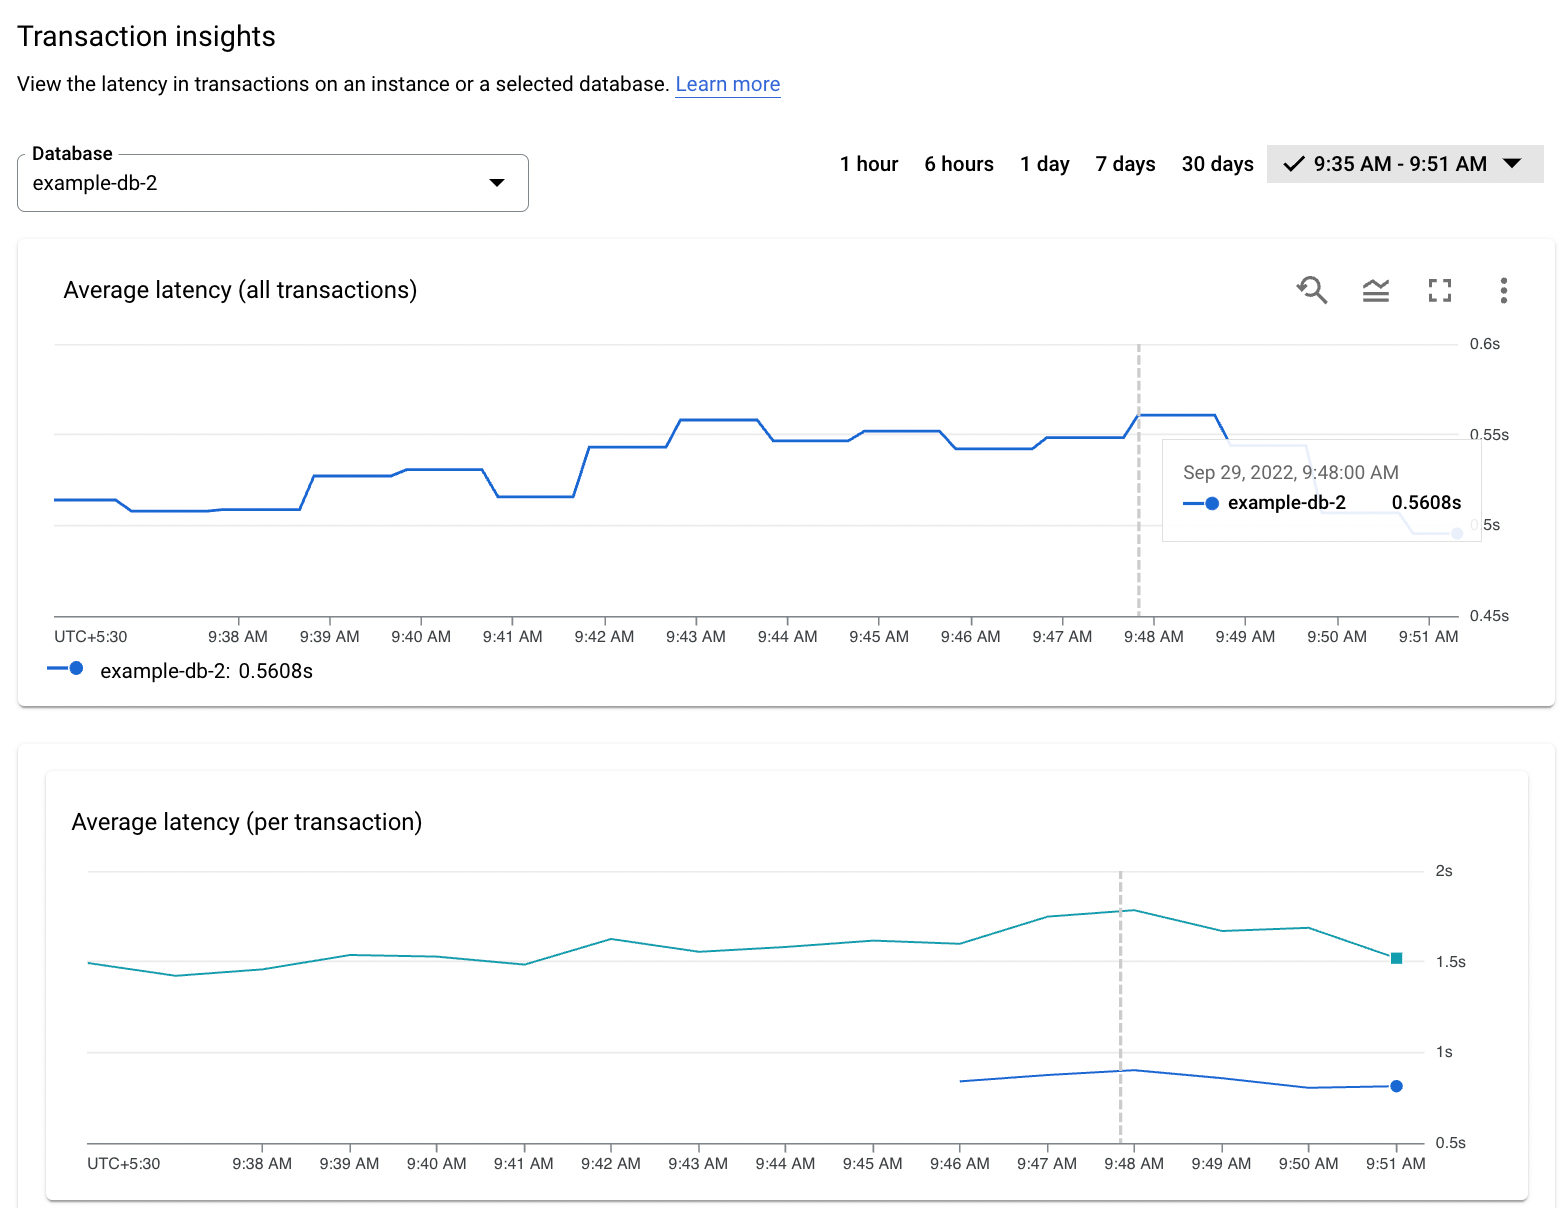
The Transaction insights dashboard helps you view the latency in transactions on an instance or a selected database. It can help you identify the transactions that might be leading to high latencies due to lock contentions.
View the latencies of transactions
To view the latency of transactions, follow these steps:
Click Transaction insights on the left navigation.
From the Databases selector at the top, select the database that shows the highest lock wait time.
Alternatively, in the Lock insights dashboard, click View transactions to filter transactions reading or writing to a specific sample column.
The data shown is for
1 hourby default, as the time selector at the upper-right corner of the Transaction insights dashboard shows.
The dashboard shows the following charts:
The Average latency (all transactions) chart displays the latency for all transactions in the instance.
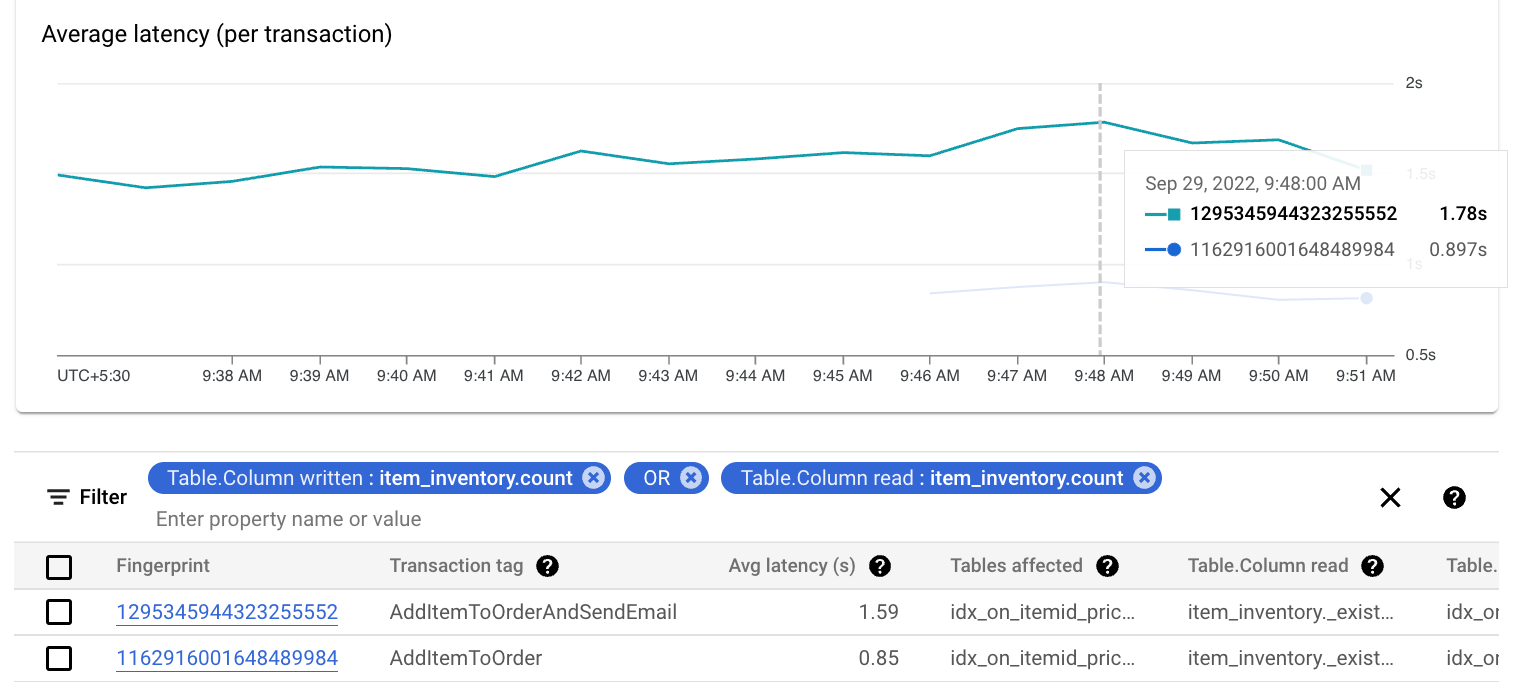
The Average latency (per transaction) chart displays the latency for each transaction for the selected database.
Analyze the transaction data
You can view and analyze data for each transaction in the table below the
charts. The table shows metrics data from the
SPANNER_SYS.TXN_STATS
system tables in the following columns:
- Fingerprint: The hash of the transaction tag, if it exists. Otherwise, the hash is calculated based on the operations involved in the transaction. The value is a link that leads to the Transaction Details page.
- Transaction tag: The optional transaction tag
for the transaction. Statistical data for multiple transactions that have the
same tag string is grouped in a single row with the
TRANSACTION_TAGlabel matching the tag string. - Tables affected: The tables affected by the transaction.
- Table.column Read: The columns that the transaction read from.
- Table.column Written: The columns that the transaction wrote to.
- Avg latency (seconds): Average seconds taken to perform the transaction. By default, the table is sorted by this column in descending order.
To correlate the data on the Average latency (per transaction) chart with the data in the table, select a line on the chart. The corresponding row in the table appears highlighted.
To filter the data in the table, do the following:
Click next to Filter.
Select a property, select an operator, and specify a value.
The table shows data matching the filter.
View detailed information about a transaction
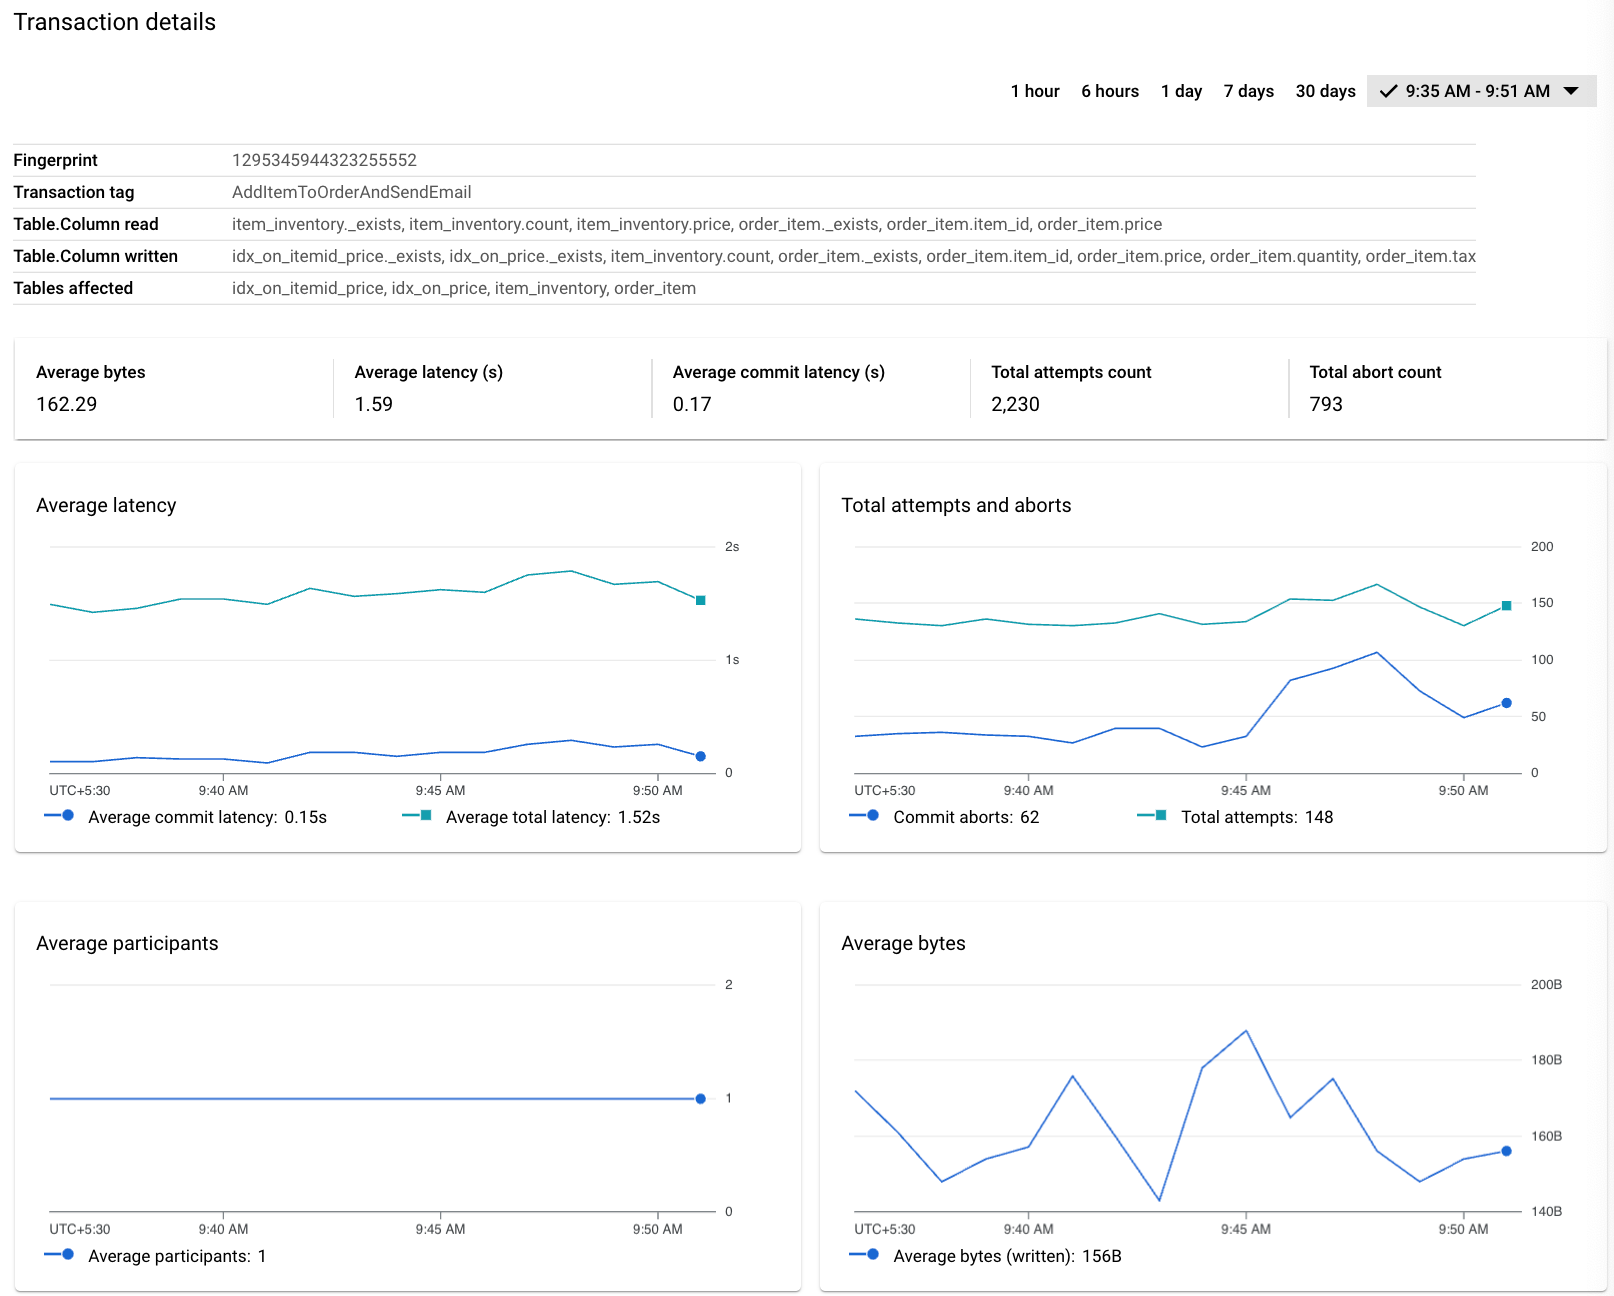
To view detailed information about a transaction, such as the one showing the highest latency, click the Fingerprint link on the respective row in the table.
The Transaction details page appears. Besides the details table at the top, it shows the following information:
A bar showing numeric values for each of these metrics:
- Average bytes: The average number of bytes written by the transaction.
- Average latency: The average seconds taken from the first operation of the transaction to commit or abort.
- Average commit latency: The average seconds taken to perform the commit operation.
- Total attempt count: The total number of transaction attempts.
- Total abort count: The total number of transaction attempts that were aborted, including those that are aborted before calling the transaction's commit method.
Charts depicting these values.
Additionally, the Average participants chart shows the average number of participants in each commit attempt.
Investigate if the transaction shape can be optimized to reduce latencies. Consider applying the recommended practices to reduce lock contention.