This page gives an overview of the high-level components involved in a Spanner request and how each component can affect latency.
Spanner API requests
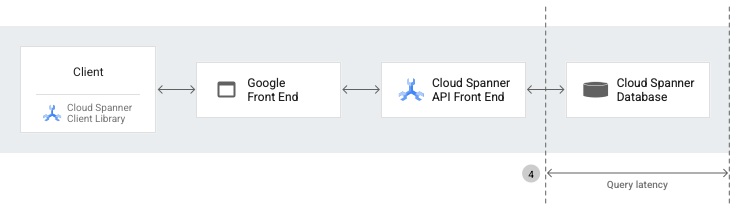
The high-level components that are used to make a Spanner API request include:
Spanner client libraries, which provide a layer of abstraction on top of gRPC, and handle server communication details, such as session management, transactions, and retries.
The Google Front End (GFE), which is an infrastructure service that's common to all Google Cloud services, including Spanner. The GFE verifies that all Transport Layer Security (TLS) connections are stopped and applies protections against Denial of Service attacks. To learn more about the GFE, see Google Front End Service.
The Spanner API frontend (AFE), which performs various checks on the API request (including authentication, authorization, and quota checks) , and maintains sessions and transaction states.
The Spanner database, which executes reads and writes to the database.
When you make a remote procedure call to Spanner, the Spanner client libraries prepare the API request. Then, the API request passes through both the GFE and the Spanner AFE before reaching the Spanner database.
By measuring and comparing the request latencies between different components and the database, you can determine which component is causing the problem. These latencies include client round-trip, GFE, Spanner API request, and query latencies.
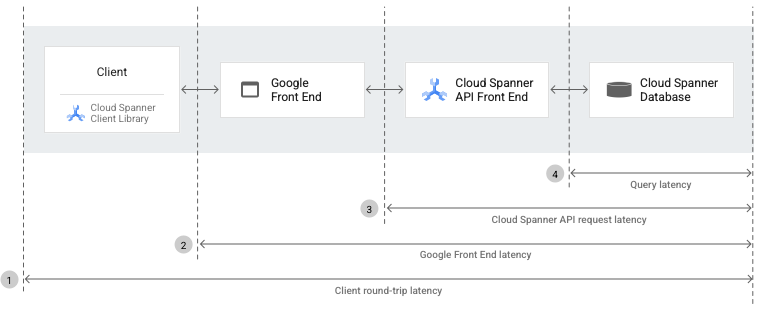
The following sections explain each type of latency you see in the previous diagram.
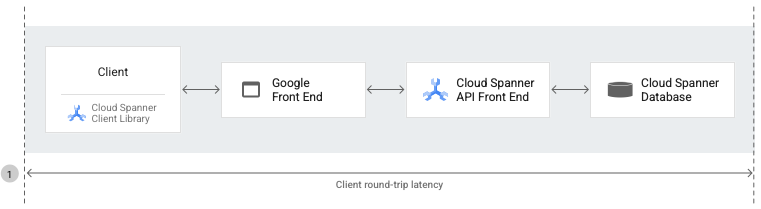
Client round-trip latency
Client round-trip latency is the length of time (in milliseconds) between the first byte of the Spanner API request that the client sends to the database (through both the GFE and the Spanner API front end), and the last byte of response that the client receives from the database.
The grpc.io/client/roundtrip_latency
metric provides the time between the first byte of the API request sent to the
last byte of the response received.
To capture and visualize latency for this component, see Capture client round-trip latency with OpenTelemetry or with OpenCensus.
GFE latency
Google Front End (GFE) latency is the length of time (in milliseconds) between when the Google network receives a remote procedure call from the client and when the GFE receives the first byte of the response. This latency doesn't include any TCP/SSL handshake.
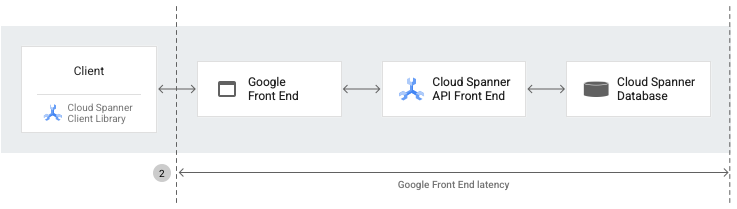
Every response from Spanner, whether it's REST or gRPC, includes a header that contains the total time between the GFE and the backend (the Spanner service) for both the request and the response. This helps to differentiate better the source of the latency between the client and the Google network.
The spanner/gfe_latency
metric captures and exposes GFE latency for Spanner requests.
To capture and visualize latency for this component, see Capture GFE latency with OpenTelemetry or with OpenCensus.
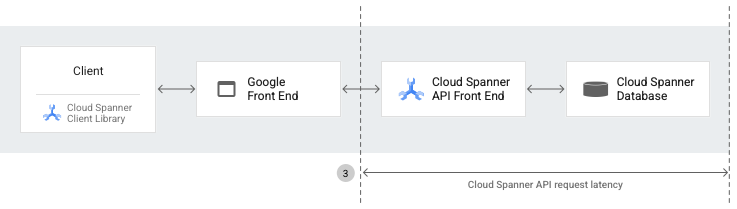
Spanner API request latency
Spanner API request latency is the length of time (in seconds) between the first byte of request that the Spanner AFE receives and the last byte of response that the Spanner API frontend sends. The latency includes the time needed for processing API requests in both the Spanner backend and the API layer. However, this latency doesn't include network or reverse-proxy overhead between Spanner clients and servers.
The spanner.googleapis.com/api/request_latencies metric captures
and exposes Spanner AFE latency for
Spanner requests.
To capture and visualize latency for this component, see Capture Spanner API request latency with OpenTelemetry or with OpenCensus.
Query latency
Query latency is the length of time (in milliseconds) that it takes to run SQL queries in the Spanner database.
Query latency is available for the executeSql API.
If the QueryMode
parameter is set to WITH_STATS or WITH_PLAN_AND_STATS, then Spanner's
ResultSetStats
are available in the responses. ResultSetStats includes the elapsed time for running queries in
the Spanner database.
To capture and visualize latency for this component, see Capture query latency with OpenTelemetry or with OpenCensus.
What's next
- Learn how to identify latency points in Spanner components.