本頁面說明如何使用 Hotspot 洞察資訊資訊主頁,偵測 Spanner 資料庫中的熱點。
資源使用率不均洞察總覽
熱點會導致 Spanner 資料庫發生延遲。資源使用率不均的深入分析資訊主頁可協助您偵測受資源使用率不均影響的分割。請按照下列步驟操作,判斷熱點是否導致延遲,以及如何解決問題:
熱點洞察資料適用於單一區域、多區域和雙區域設定。
定價
使用熱點洞察資料不須支付額外費用。
資料保留
熱點洞察圖表和資料表的資料保留期限上限為 6 小時。
最熱門的分割表資料取自 SPANNER_SYS.SPLIT_STATS_TOP_MINUTE 表格,最多保留 6 小時。詳情請參閱「資料保留」。
必要的角色
視您是 IAM 使用者還是精密控制權限使用者,您可能需要不同的 IAM 角色和權限。
身分與存取權管理 (IAM) 使用者
如要取得查看「熱點洞察」頁面所需的權限,請要求管理員在執行個體上授予下列 IAM 角色:
-
Cloud Spanner 檢視者 (
roles/spanner.viewer) -
Cloud Spanner 資料庫讀取者 (
roles/spanner.databaseReader)
如要查看「熱點洞察」頁面,您必須具備 Cloud Spanner 資料庫讀取者 (
roles/spanner.databaseReader) 角色的下列權限:
spanner.databases.beginReadOnlyTransactionspanner.databases.selectspanner.sessions.create
精細的存取權控管機制使用者
如果您是精細存取權控管機制使用者,請務必:
- 具備 Cloud Spanner 檢視者 (
roles/spanner.viewer) - 擁有精細的存取權控管權限,並獲派
spanner_sys_reader系統角色或其中一個成員角色。 - 在資料庫的「總覽」頁面中,選取
spanner_sys_reader或成員角色做為目前的系統角色。
詳情請參閱精細存取權控管總覽和精細存取權控管系統角色。
開啟「資源使用率不均洞察」資訊主頁
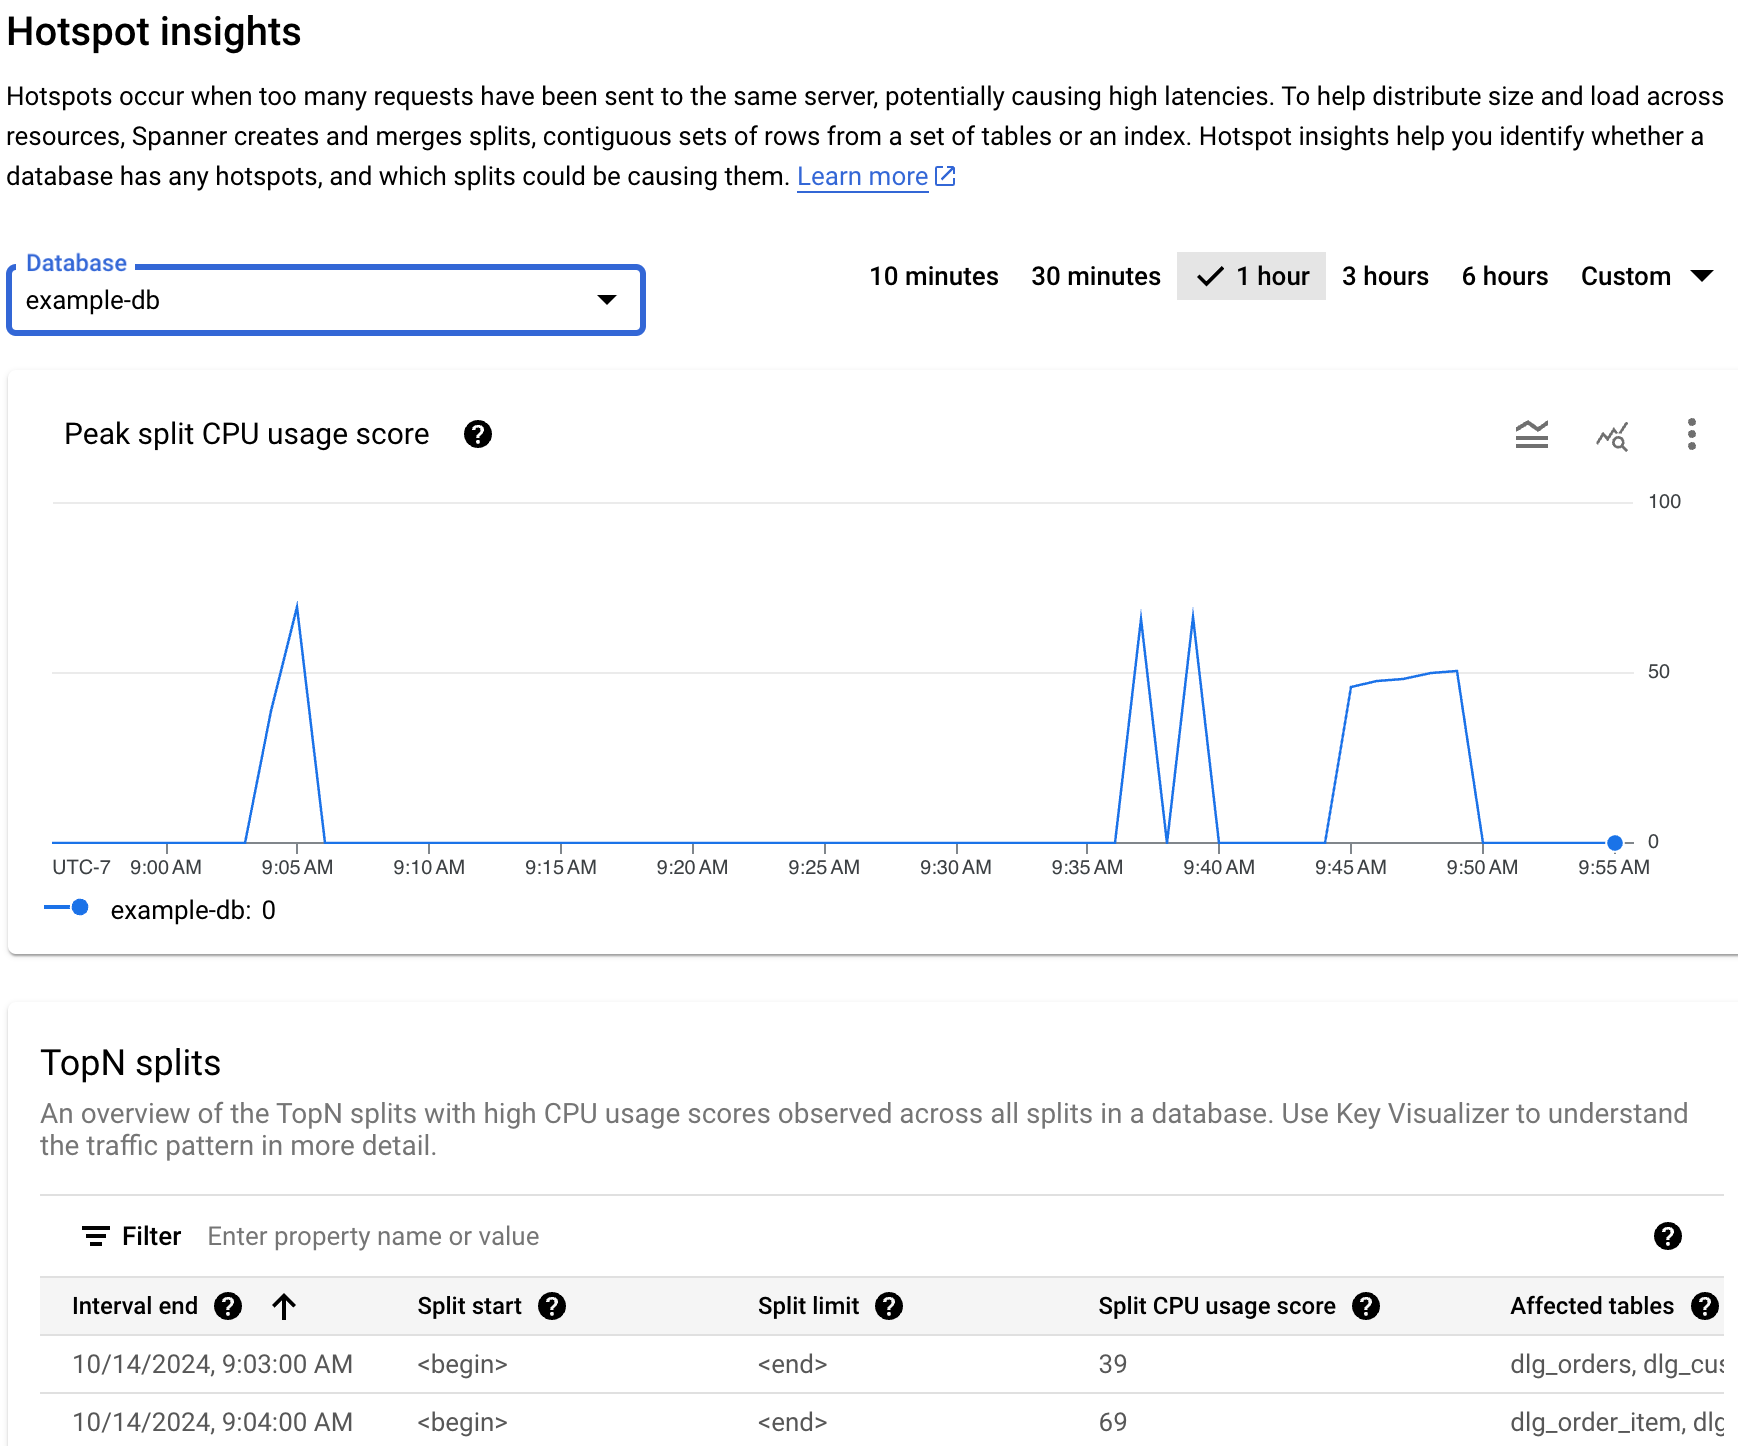
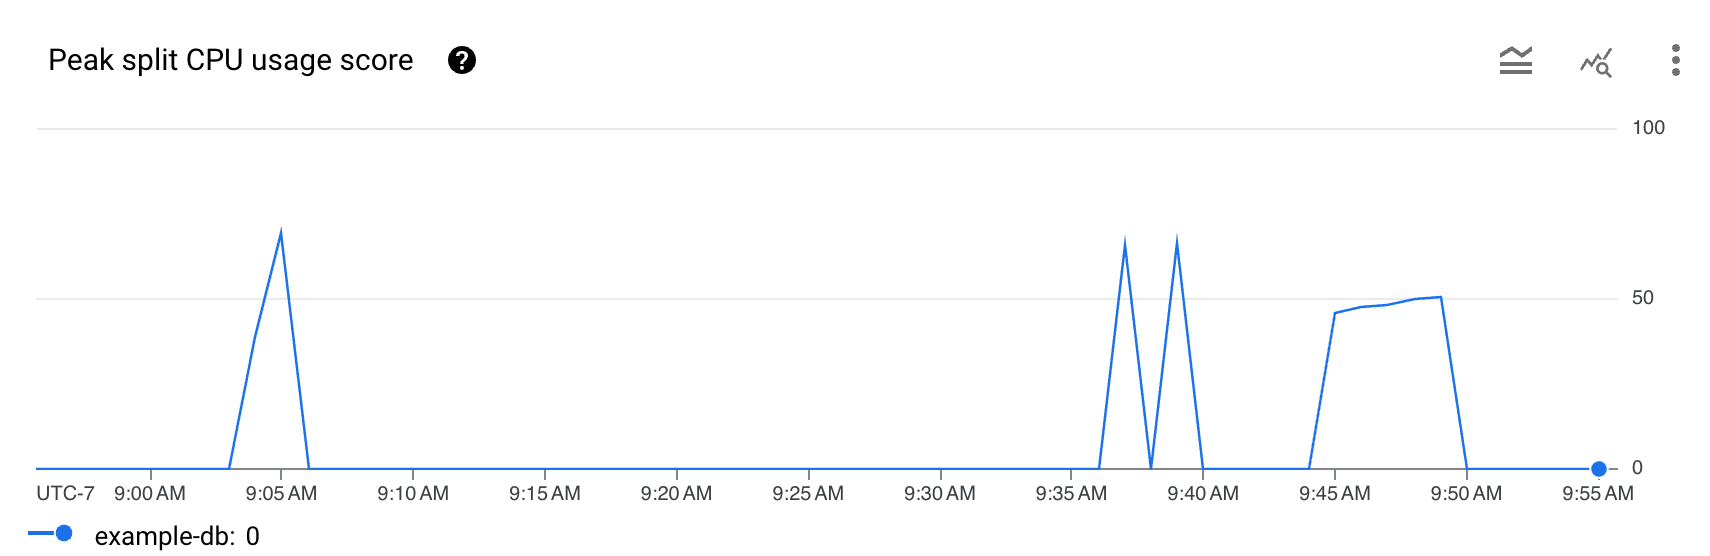
「熱點洞察」資訊主頁會顯示最高的分割 CPU 用量百分比。這項指標是介於 0 到 100 的抽象百分比,反映存取分割內資料列時耗用的 CPU 數量。
如要查看資料庫的「資源使用率不均的深入分析結果」資訊主頁,請按照下列步驟操作:
在 Google Cloud 控制台中,開啟「Spanner」頁面。
從清單中選取執行個體。
在導覽選單中,按一下「熱點洞察」分頁標籤。
在「資料庫」欄位中,從清單選取資料庫。資訊主頁會顯示資料庫的最高分割 CPU 用量分數。
資訊主頁的區域包括:
- 「最高的分割 CPU 用量分數」圖表:較高的 CPU 用量分數 (例如接近 100) 代表分割相當熱門,伺服器極有可能出現資源使用率不均的情況。
- 資料庫欄位:篩選特定資料庫或所有資料庫的熱分割資訊。
- 時間範圍篩選器:以 1 分鐘為增量,篩選最多 6 小時的最高分割 CPU 用量。
- 前 N 個分割區資料表:顯示依分割區 CPU 用量分數排序的前幾名分割區清單。
判斷熱點是否需要介入措施
如果圖表顯示整體延遲時間有尖峰或升高,且分割 CPU 用量分數持續偏高,則可能需要進一步調查。
查看圖表,瞭解下列問題的答案:
哪個資料庫的延遲時間變長?從「資料庫」清單中選取其他資料庫,找出延遲時間最長的資料庫。如要找出負載最高的資料庫,您也可以在 Google Cloud 控制台中查看資料庫的延遲時間圖表。
延遲時間是否很長?與工作負載的預期延遲時間相比,延遲時間是否偏高?圖表是否出現尖峰,或隨著時間推移而升高?如果沒有看到高延遲,表示熱點不是問題。
最高的分割 CPU 用量分數是否為 100%?圖表是否出現尖峰,或隨著時間推移而升高?如果持續 10 分鐘以上,您都未看到 CPU 使用率達到 100% 的尖峰值,則熱點可能不是問題。如果分割的 CPU 使用率百分比在尖峰時段偏高,且持續超過 10 分鐘,建議您進一步調查,看看資料庫的延遲時間是否高於預期。
如果分割 CPU 使用率百分比在 10 分鐘內達到 100% 尖峰值,則可能需要介入處理資源使用率不均的情況。接下來,您可以繼續進行偵錯,找出資料庫中資源使用率不均的分割。
找出有問題的熱分割
如要找出可能出現熱點的問題分割,請參閱 Google Cloud 控制台中的「TopN splits」(前 N 個分割)部分,如下所示。
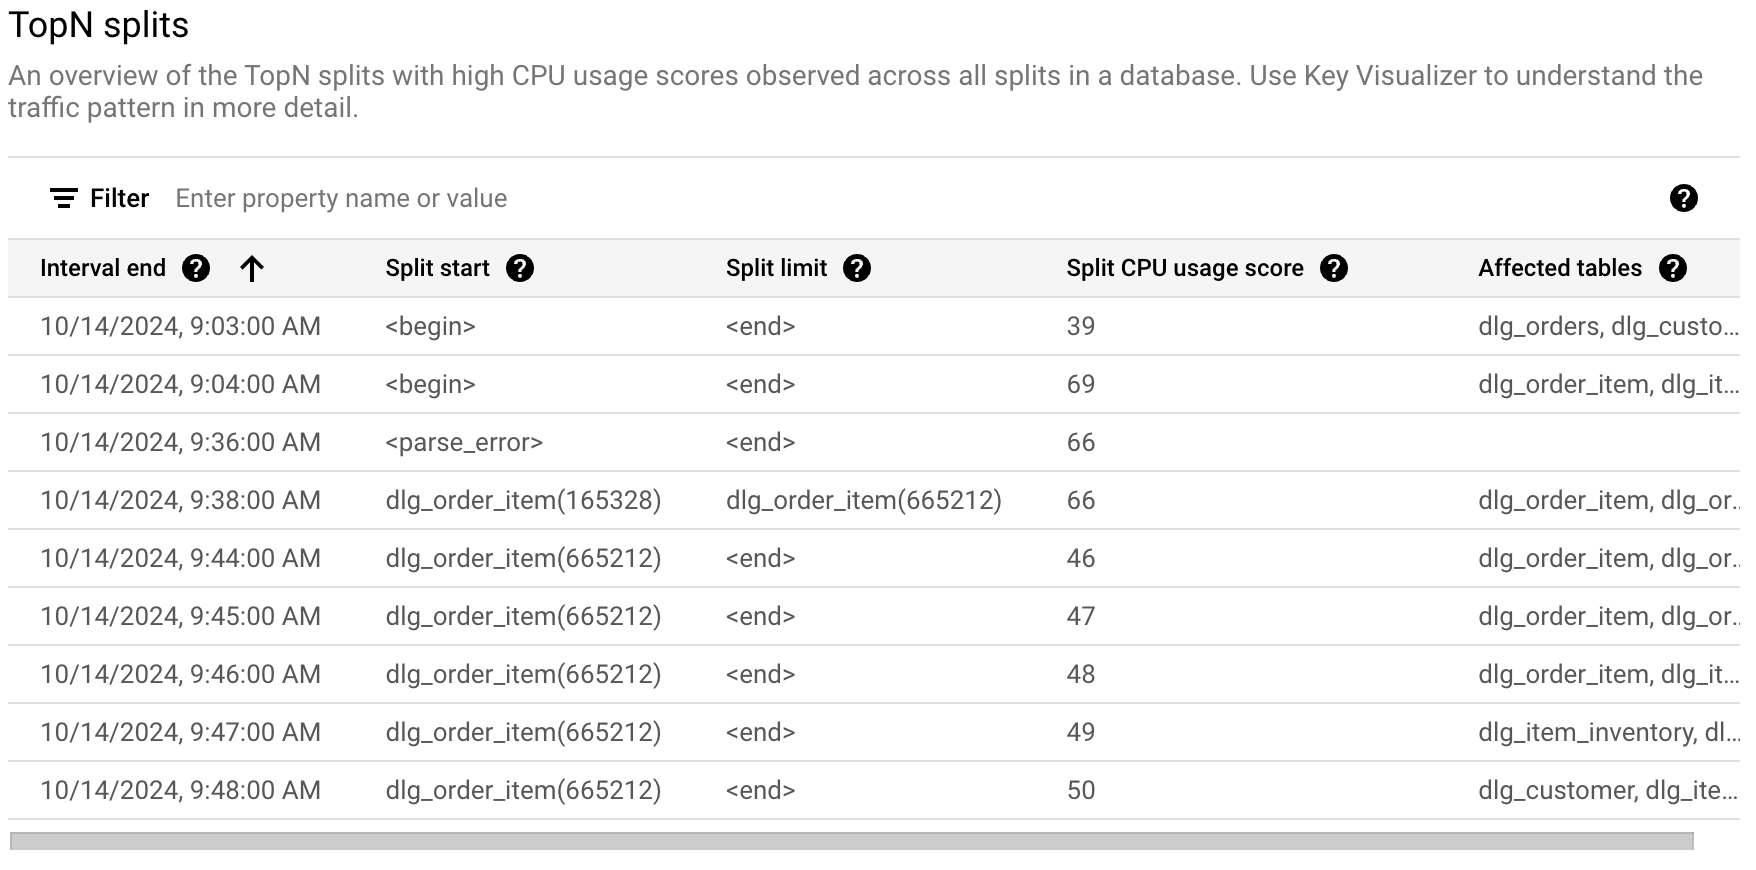
「TopN 分成」表格會顯示所選時間範圍內可能熱門的分成,並依時間排序 (從最新到最早)。TopN 分割數上限為 100。
就圖表而言,Spanner 會從 TopN 分割統計資料表擷取資料,細微程度為一分鐘。圖表中每個資料點的值,代表一分鐘間隔內的平均值。
表格會顯示下列屬性:
- 間隔結束:CPU 使用率高峰期結束的日期和時間。
- 分割起始鍵:分割內資料列範圍的起始鍵。如果分割起始位置是 <begin>,代表資料庫鍵範圍的開頭。
- 分割極限:分割內資料列範圍的極限鍵。如果極限鍵是 <end>,則表示資料庫鍵範圍的結尾。
- 分割 CPU 用量分數:抽象分數介於 0 至 100 之間,呈現出某個伺服器中,存取分割內資料列耗用的 CPU 數量。您可以參考 CPU 用量分數,評估是否有資源使用率不均的情況。
- 受影響的資料表:所含資料列可能儲存於分割的資料表。
後續步驟
- 瞭解分割熱點統計資料