本页面介绍了如何使用“热点分析洞见”信息中心检测 Spanner 数据库中的热点。
热点分析洞见概览
热点会导致 Spanner 数据库出现延迟时间。“热点分析洞见”信息中心可帮助您检测受热点影响的分块。请按照以下步骤确定热点是否导致延迟时间,如果导致延迟时间,请按照以下步骤解决问题:
热点分析洞见功能适用于单区域、多区域和双区域配置。
价格
热点分析洞见不会产生额外费用。
数据保留
“热点分析洞见”图表和表格的最长数据保留期限为 6 小时。
对于最热分块表,数据取自 SPANNER_SYS.SPLIT_STATS_TOP_MINUTE 表,该表的最长保留期限为 6 小时。如需了解详情,请参阅数据保留。
所需的角色
您可能需要不同的 IAM 角色和权限,具体取决于您是 IAM 用户还是精细访问权限控制用户。
Identity and Access Management (IAM) 用户
如需获得查看热点分析洞见页面所需的权限,请让您的管理员向您授予实例的以下 IAM 角色:
-
Cloud Spanner Viewer (
roles/spanner.viewer) -
Cloud Spanner Database Reader (
roles/spanner.databaseReader)
如需查看热点分析洞见页面,您需要拥有 Cloud Spanner Database Reader (
roles/spanner.databaseReader) 角色中的以下权限:
spanner.databases.beginReadOnlyTransactionspanner.databases.selectspanner.sessions.create
精细访问权限控制用户
如果您是精细访问权限控制用户,请确保您:
- 拥有 Cloud Spanner Viewer (
roles/spanner.viewer) - 拥有精细访问权限控制权限,并且被授予
spanner_sys_reader系统角色或其成员角色之一。 - 在数据库概览页面上,选择
spanner_sys_reader或成员角色作为您当前的系统角色。
如需了解详情,请参阅精细访问权限控制概览和精细访问权限控制系统角色。
打开“热点分析洞见”信息中心
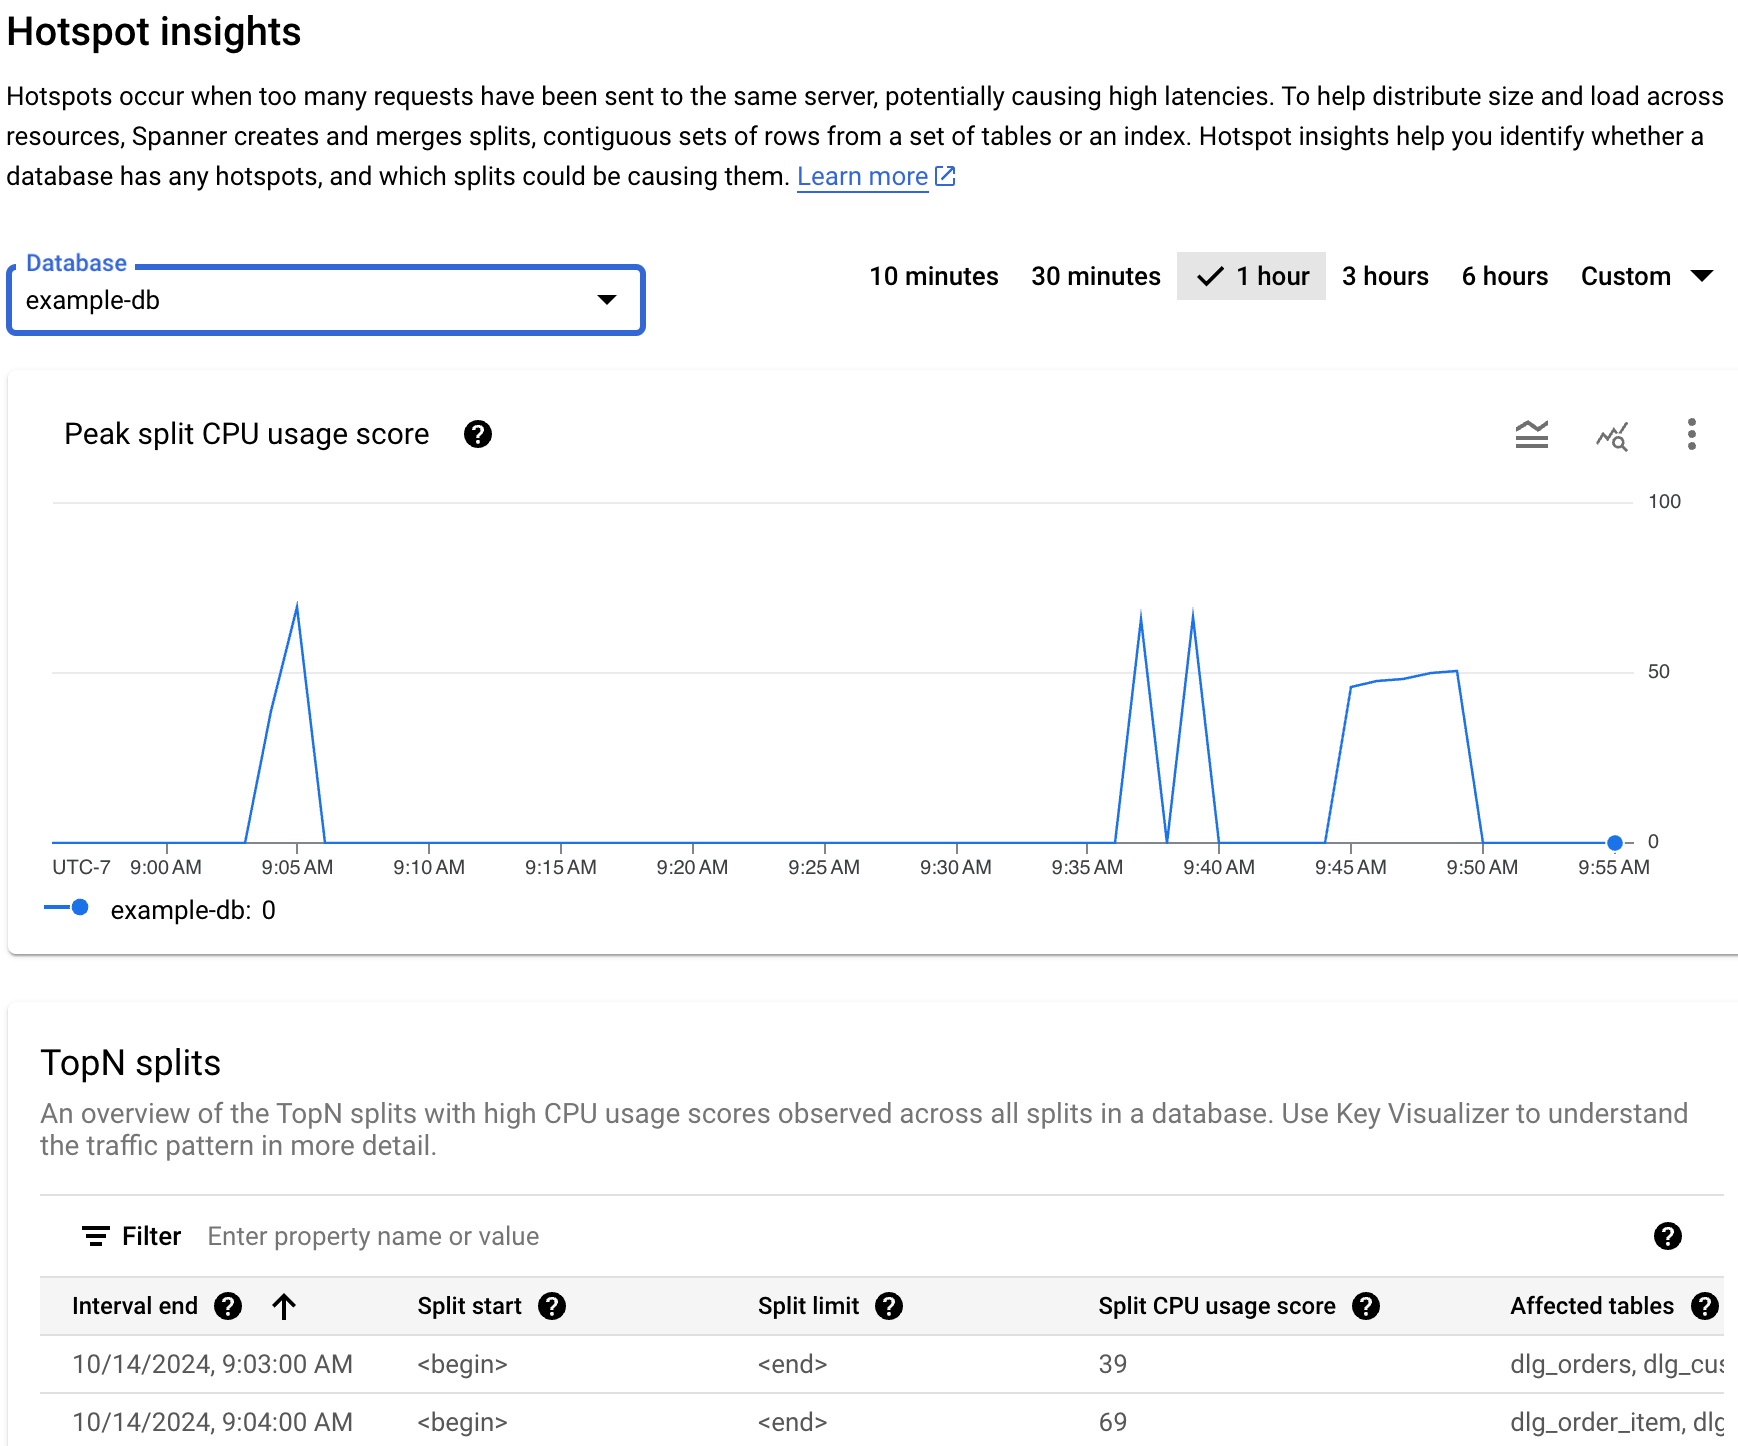
热点分析洞见信息中心会显示峰值分块 CPU 使用率百分比。此指标是一个介于 0 到 100 之间的抽象百分比,反映了访问分块内的行时所使用的 CPU 数量。
如需查看数据库的热点分析洞见信息中心,请执行以下操作:
在 Google Cloud 控制台中,打开 Spanner 页面。
从列表中选择一个实例。
在导航菜单中,点击热点分析洞见标签页。
在数据库字段中,从列表中选择一个数据库。该信息中心会显示数据库的峰值分块 CPU 使用率得分。
信息中心包含以下部分:
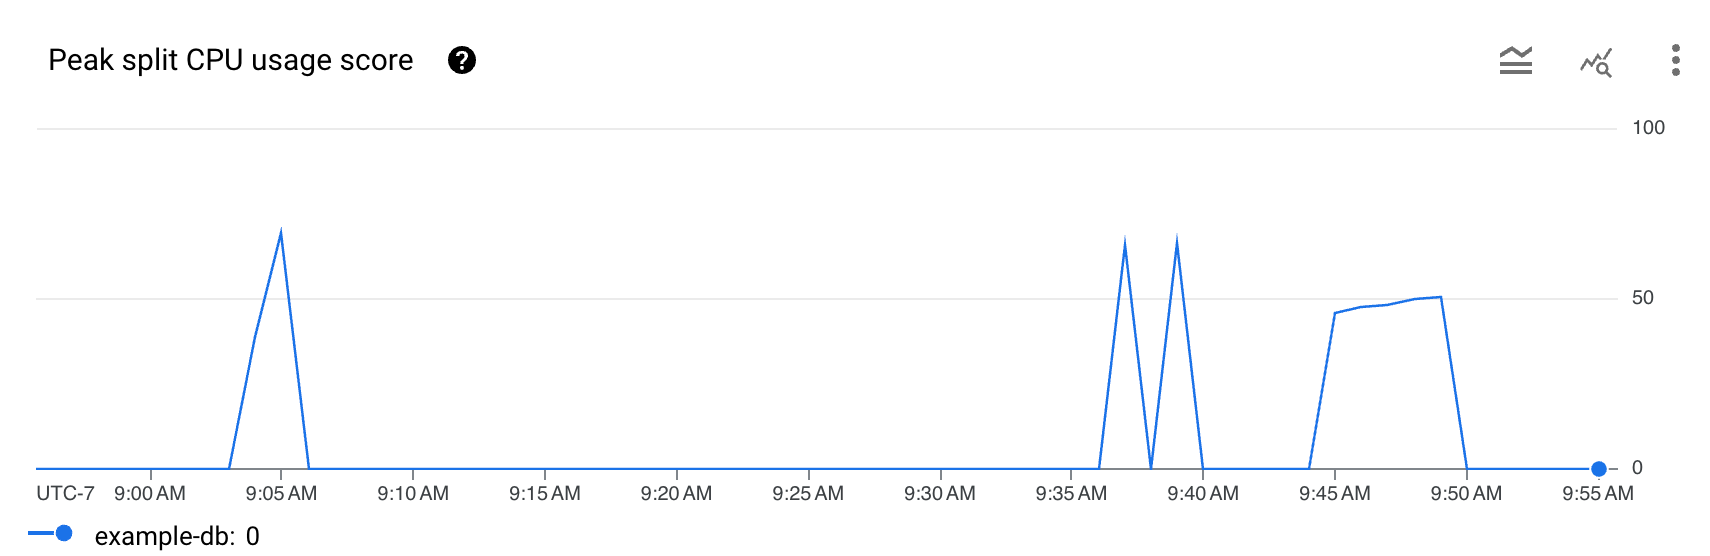
- 峰值分块 CPU 使用率得分图表:较高的 CPU 使用率得分(例如,接近 100)表示相应分块较热,很可能导致服务器上出现热点(与较低的得分相比)。
- 数据库字段:过滤特定数据库或所有数据库上的热分块信息。
- 时间范围过滤条件:按 1 分钟的增量过滤峰值分块 CPU 使用率(最长总共 6 小时)。
- “最热的 N 个分块”表:显示按分块 CPU 使用率得分排序的热分块列表。
确定热点是否需要干预
如果您在图表中看到与总体延迟时间相对应的峰值或升高,并且峰值分块 CPU 使用率得分持续较高,则可能需要进一步调查。
查看图表,探索以下问题:
哪个数据库的延迟时间变长了?从数据库列表中选择不同的数据库,找出延迟时间最长的数据库。如需了解哪个数据库的负载最高,您还可以在 Google Cloud 控制台中查看数据库的延迟时间图表。
延迟时间是否较长?与工作负载的预期延迟时间相比,延迟时间是否较长?图表是否随着时间推移出现峰值或上升?如果延迟时间不长,则热点不是什么问题。
峰值分块 CPU 使用率得分是否为 100%?图表是否随着时间推移出现峰值或上升?如果至少在 10 分钟内未出现持续 100% 的峰值分块 CPU 使用率百分比,则热点可能不是什么问题。如果峰值分块 CPU 使用率百分比在 10 分钟以上的时间内保持在较高水平,您可能需要进一步调查,看看数据库的延迟时间是否高于预期水平。
如果您发现峰值分块 CPU 使用率达到 100% 的持续时间超过 10 分钟,则热点可能需要您的干预。接下来,您可以继续调试之旅,识别数据库中的热分块。
识别有问题的热分块
如需识别可能存在热点的有问题的分块,请参阅 Google Cloud 控制台中的最热的 N 个分块部分,如下所示。
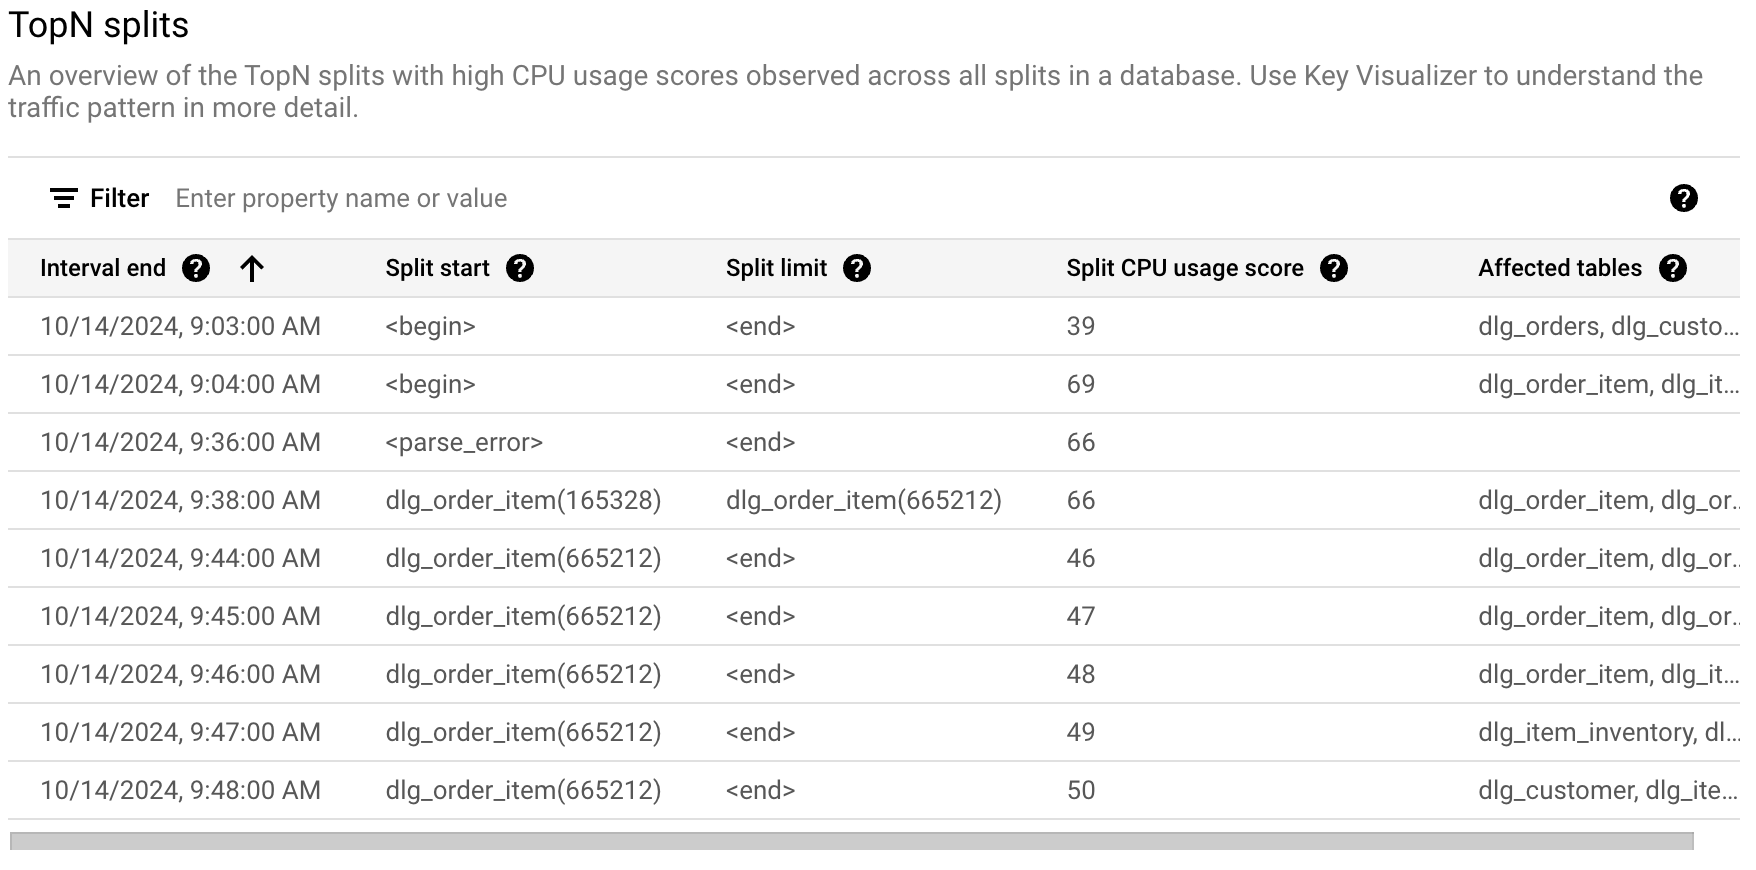
最热的 N 个分块表提供所选时间范围内可能较热的分块概览,并按从最晚到最早的顺序排序。最热的 N 个分块的数量上限为 100。
对于图表,Spanner 会从最热的 N 个分块统计信息表中提取数据,粒度为 1 分钟。图表中每个数据点的值表示 1 分钟时间间隔内的平均值。
下表显示了以下属性:
- 间隔结束时间:CPU 使用率高峰结束的日期和时间。
- 分块起始键:分块中行范围的起始键。如果分块起始键是 <begin>,则表示数据库键范围的起始位置。
- 分块限制键:分块中行范围的限制键。如果限制键是 <end>,则表示数据库键范围的结束位置。
- 分块 CPU 使用率分数:介于 0 到 100 之间的抽象分数,反映了用户访问单个服务器的分块内的行时所使用的 CPU 数量。使用 CPU 使用率分数有助于评估是否存在热点。
- 受影响的表:可能有行位于分块中的表。
后续步骤
- 了解分块热点统计信息