이 페이지에서는 핫스팟 통계 대시보드를 사용하여 Spanner 데이터베이스의 핫스팟을 감지하는 방법을 설명합니다.
핫스팟 통계 개요
핫스팟으로 인해 Spanner 데이터베 이스에 지연 시간이 발생합니다. 핫스팟 통계 대시보드를 사용하면 핫스팟의 영향을 받는 분할을 감지할 수 있습니다. 핫스팟으로 인해 지연 시간이 발생하는지 확인하고 발생하는 경우 문제를 해결하는 방법을 알아보려면 다음 단계를 따르세요.
핫스팟 통계는 단일 리전, 멀티 리전, 이중 리전 구성에서 사용할 수 있습니다.
가격 책정
핫스팟 통계는 추가 비용 없이 사용할 수 있습니다.
데이터 보관
핫스팟 통계 차트 및 테이블의 최대 데이터 보관 기간은 6시간입니다.
사용률이 가장 높은 분할 테이블의 경우 최대 보관 기간이 6시간인 SPANNER_SYS.SPLIT_STATS_TOP_MINUTE 테이블에서 데이터를 가져옵니다. 자세한 내용은 데이터 보관을 참조하세요.
필요한 역할
IAM 사용자인지 또는 세분화된 액세스 제어 사용자인지에 따라 다른 IAM 역할 및 권한이 필요할 수 있습니다.
Identity and Access Management(IAM) 사용자
핫스팟 통계 페이지를 보는 데 필요한 권한을 얻으려면 관리자에게 인스턴스에 대한 다음 IAM 역할을 부여해 달라고 요청하세요.
-
Cloud Spanner 뷰어(
roles/spanner.viewer) -
Cloud Spanner 데이터베이스 리더(
roles/spanner.databaseReader)
핫스팟 통계 페이지를 보려면 Cloud Spanner 데이터베이스 리더(
roles/spanner.databaseReader) 역할의 다음 권한이 필요합니다.
spanner.databases.beginReadOnlyTransactionspanner.databases.selectspanner.sessions.create
세분화된 액세스 제어 사용자
세분화된 액세스 제어 사용자인 경우 다음을 확인합니다.
- Cloud Spanner 뷰어(
roles/spanner.viewer)입니다. - 세분화된 액세스 제어 권한이 있고
spanner_sys_reader시스템 역할 또는 구성원 역할 중 하나를 부여받아야 함 - 데이터베이스 개요 페이지에서
spanner_sys_reader또는 구성원 역할을 현재 시스템 역할로 선택해야 함
자세한 내용은 세분화된 액세스 제어 개요 및 세분화된 액세스 제어 시스템 역할을 참조하세요.
핫스팟 통계 대시보드 열기
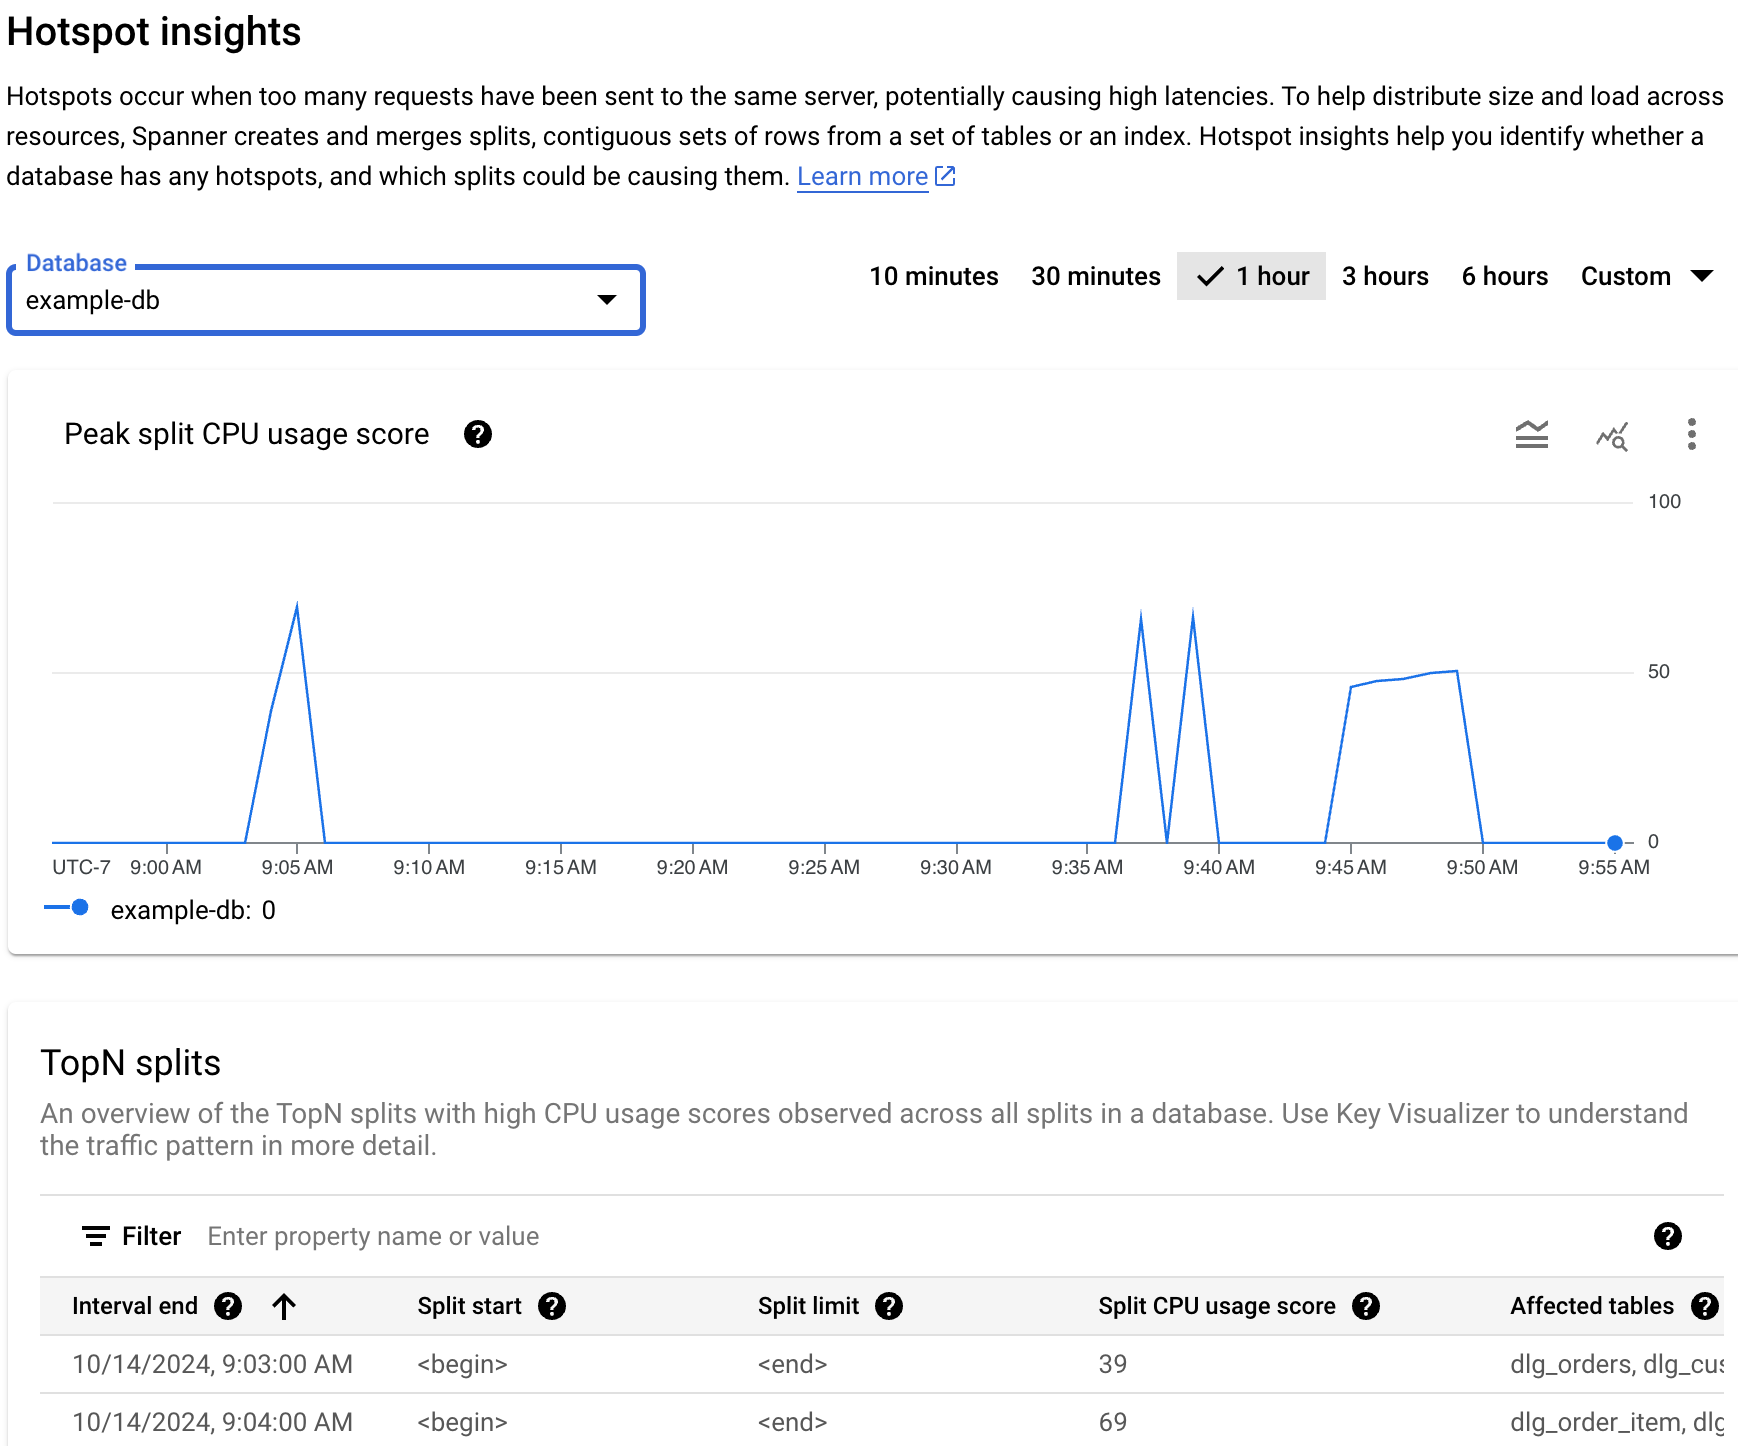
핫스팟 통계 대시보드에는 최대 분할 CPU 사용량 비율이 표시됩니다. 이 측정항목은 분할 내 행에 액세스할 때 사용된 CPU 양을 반영하는 0~100까지의 추상적인 백분율입니다.
데이터베이스의 핫스팟 통계 대시보드를 보려면 다음을 수행하세요.
Google Cloud 콘솔에서 Spanner 페이지를 엽니다.
목록에서 인스턴스를 선택합니다.
탐색 메뉴에서 핫스팟 통계 탭을 클릭합니다.
데이터베이스 필드의 목록에서 데이터베이스를 선택합니다. 대시보드에는 데이터베이스의 최대 분할 CPU 사용량 점수가 표시됩니다.
대시보드의 영역은 다음과 같습니다.
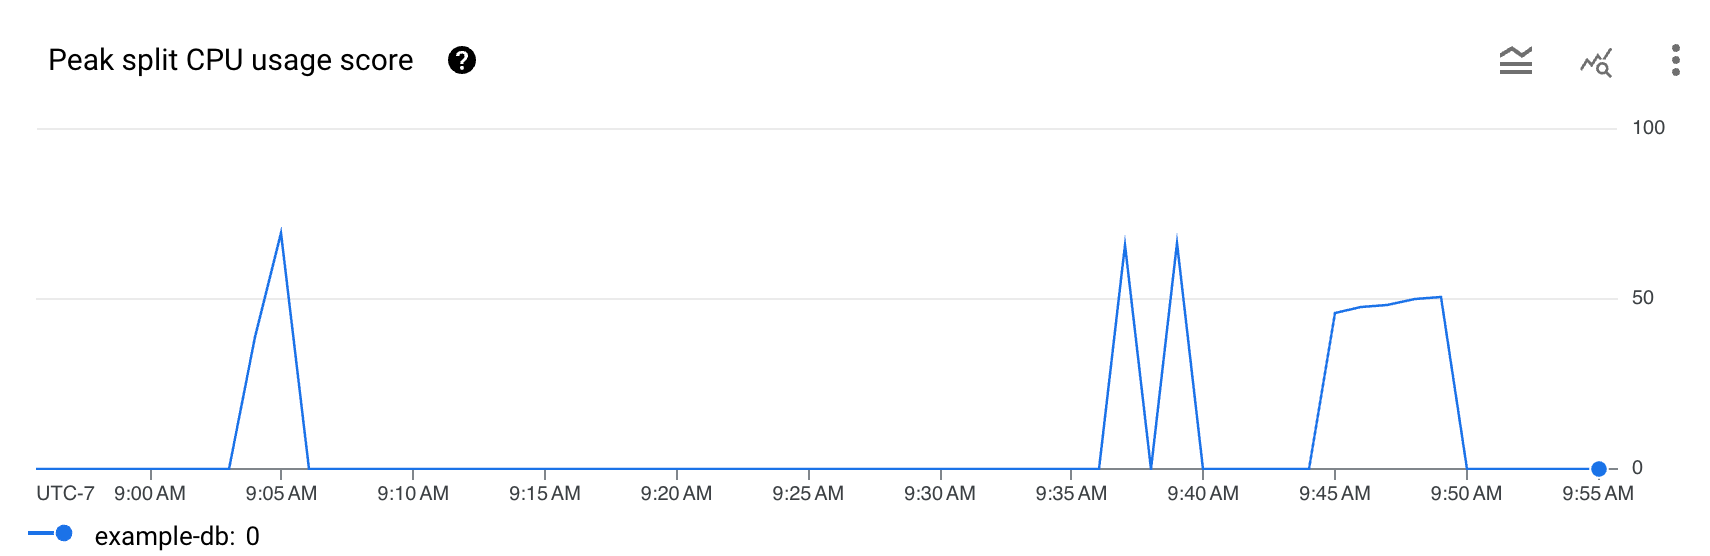
- 최대 분할 CPU 사용량 점수 그래프: CPU 사용량 점수가 높을수록(예: 100에 가까움) 분할이 많이 사용되고 낮은 점수에 비해 서버에 핫스팟이 발생할 가능성이 높습니다.
- 데이터베이스 필드: 특정 데이터베이스 또는 모든 데이터베이스의 핫 분할 정보를 필터링합니다.
- 시간 범위 필터: 최대 6시간까지 1분 단위로 최대 분할 CPU 사용량을 필터링합니다.
- 상위 N개 분할 테이블: 분할 CPU 사용량 점수순으로 정렬된 상위 분할 목록을 표시합니다.
핫스팟에 개입이 필요한지 확인
그래프에서 전체 지연 시간에 해당하는 급증 또는 상승이 표시되고 최대 분할 CPU 사용량 점수가 지속적으로 높으면 자세히 조사해야 할 수 있습니다.
그래프를 검토하여 다음 질문을 살펴보세요.
어떤 데이터베이스에서 지연 시간 악화가 발생하나요? 데이터베이스 목록에서 다른 데이터베이스를 선택하여 지연 시간이 가장 긴 데이터베이스를 찾습니다. Google Cloud 콘솔에서 데이터베이스의 지연 시간 차트를 검토하여 부하가 가장 높은 데이터베이스를 확인할 수도 있습니다.
지연 시간이 긴가요? 지연 시간이 워크로드의 예상 지연 시간에 비해 과도하게 긴가요? 시간이 지남에 따라 그래프가 급증하거나 더욱 상승하나요? 지연 시간이 길지 않으면 핫스팟 문제가 아닙니다.
최대 분할 CPU 사용량 점수가 100%인가요? 시간이 지남에 따라 그래프가 급증하거나 더욱 상승하나요? 10분 이상 100%의 최대 분할 CPU 사용량 비율이 지속되지 않으면 핫스팟 문제가 아닐 수 있습니다. 최대 분할 CPU 사용량 비율이 10분 넘게 높은 경우 데이터베이스의 지연 시간이 예상보다 높은지 자세히 조사해 볼 수 있습니다.
최대 분할 CPU 사용량 비율이 100%로 10분 넘게 표시되면 핫스팟에 개입이 필요할 수 있습니다. 그런 다음 데이터베이스의 핫 분할을 식별하여 디버깅 여정을 계속할 수 있습니다.
문제가 있는 핫 분할 식별
핫스팟이 있는 문제가 될 수 있는 분할을 식별하려면 다음과 같이 Google Cloud 콘솔의 상위 N개 분할 섹션을 참고하세요.
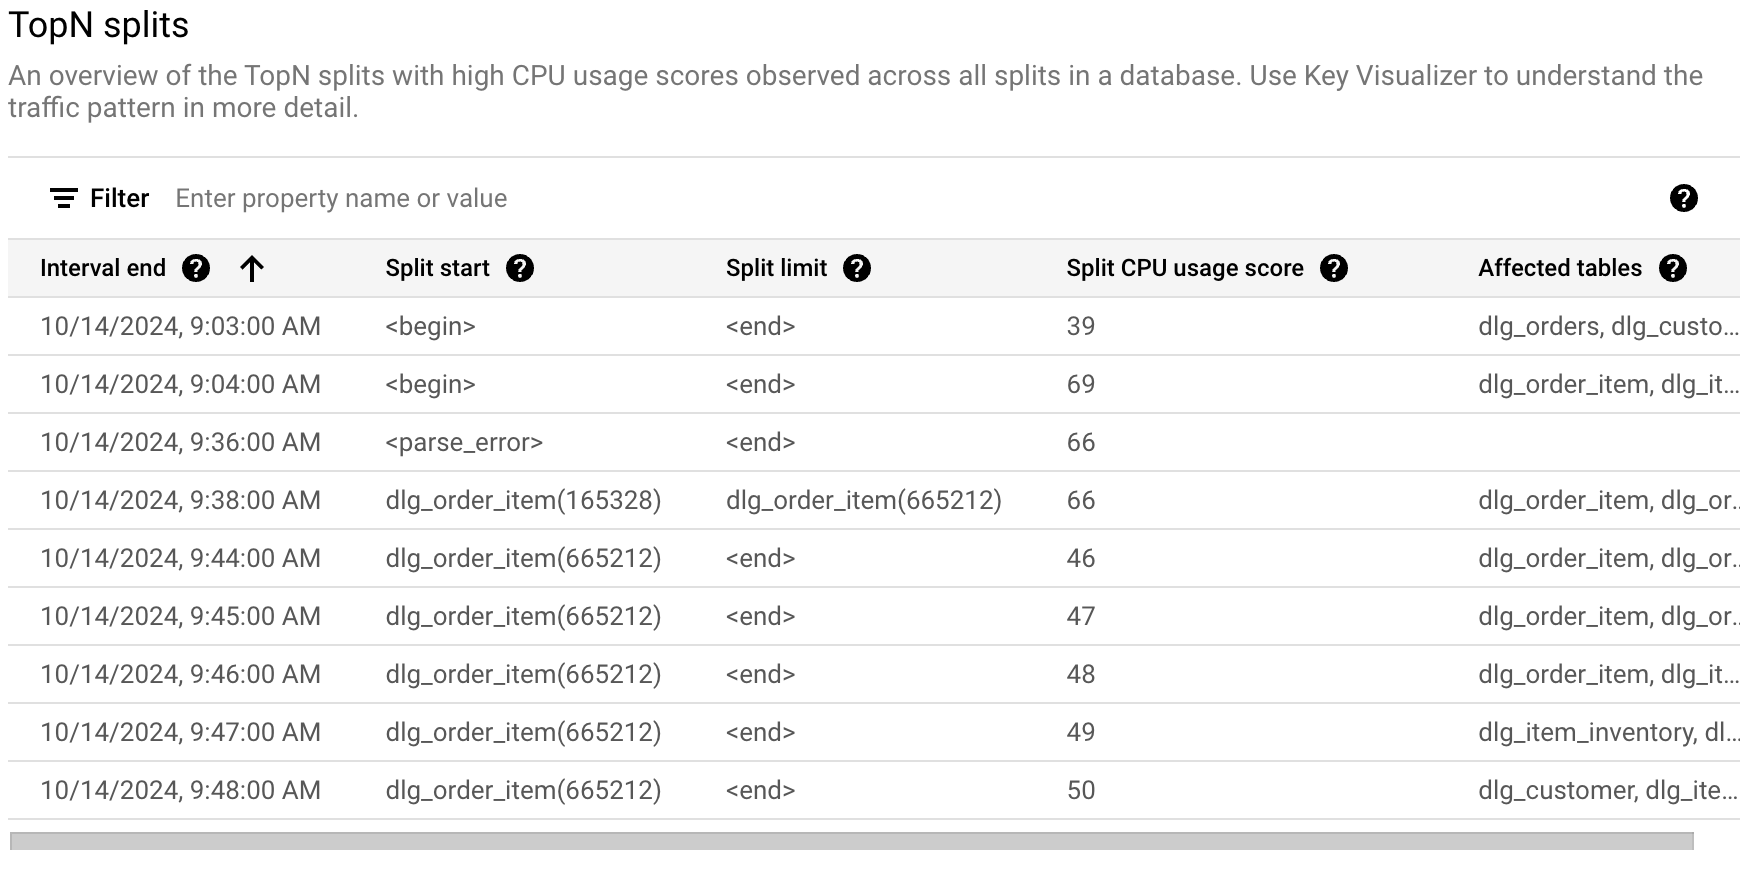
상위 N개 분할 테이블은 선택한 기간 동안 핫일 수 있는 분할에 대한 개요를 제공하며, 가장 최근 분할부터 가장 이전 분할까지 정렬됩니다. 상위 N개 분할 수는 100개로 제한됩니다.
그래프의 경우 Spanner는 분 단위의 세부사항으로 상위 N개 분할 통계 테이블에서 데이터를 가져옵니다. 그래프의 각 데이터 포인트 값은 1분 간격의 평균 값을 나타냅니다.
테이블에는 다음 속성이 표시됩니다.
- 간격 종료: CPU 사용량이 가장 높았던 기간이 종료된 날짜 및 시간입니다.
- 분할 시작: 분할에서 행 범위의 시작 키입니다. 분할 시작이 <begin>인 경우 데이터베이스의 키 범위 시작을 나타냅니다.
- 분할 한도: 분할에서 행 범위의 한도 키입니다. 한도 키가 <end>이면 데이터베이스의 키 범위가 끝났음을 나타냅니다.
- 분할 CPU 사용량 점수: 단일 서버의 분할 내 행에 대한 액세스에서 사용한 CPU 양을 반영하는 0~100까지의 추상적인 점수입니다. CPU 사용량 점수를 사용하여 핫스팟이 있는지 평가하세요.
- 영향을 받는 테이블: 분할에 행이 있을 수 있는 테이블입니다.
다음 단계
- 분할 핫스팟 통계 알아보기